
|
WP4 Public Statistics |
| (Partner) (Project) (News) (Background) (Service) | |
| eCSIRT.net > Service > Documents > WP4 Statistics |
|
The statistics on this page provide information about the general hazard level of internet connected systems. The data is collected automatically using Intrusion Detection Systems (IDS). The IDS sensors are autonomous systems without providing any services. This way every connection to these systems cannot be a valid request but can be counted as an act of scanning or attacking. The sensors are using honeypot techniques to be able to answer to requests of attackers, so the IDS sensors can record these events. The sensors are running on hosts in different European countries. |
|
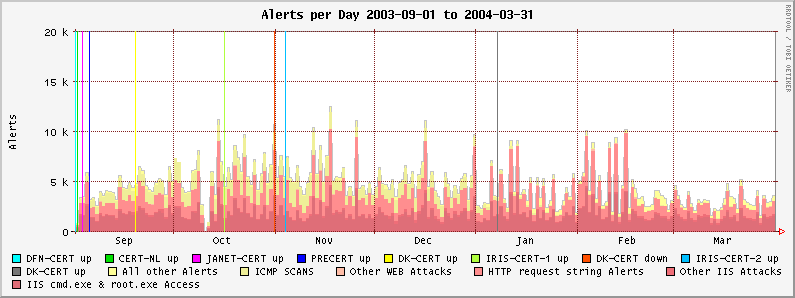
The following graph shows all alerts since the deployment of the sensors. The deployment of each sensor is marked in the graph at the according time.
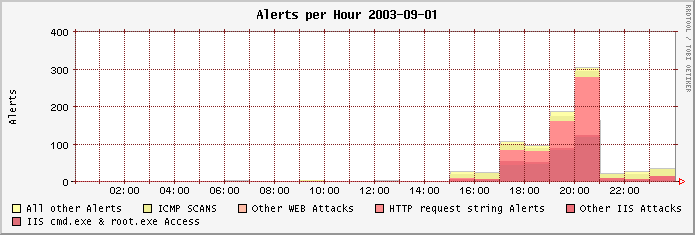
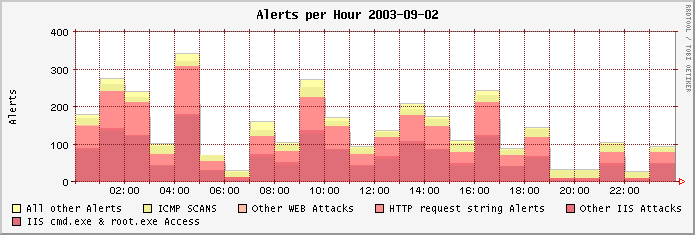
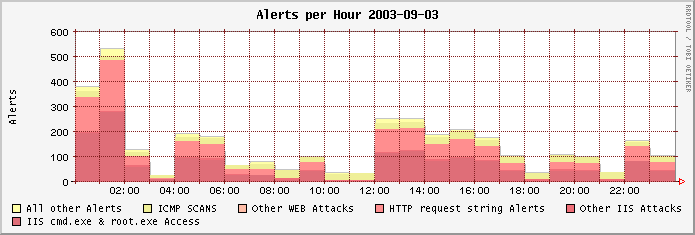
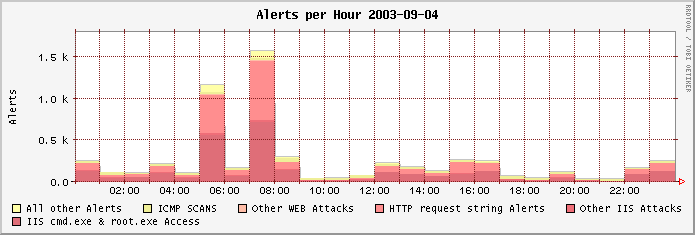
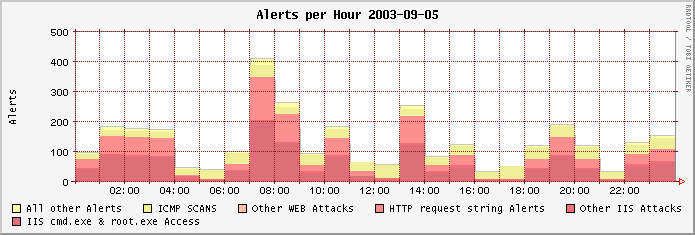
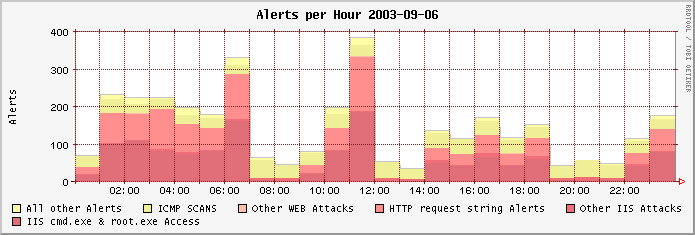
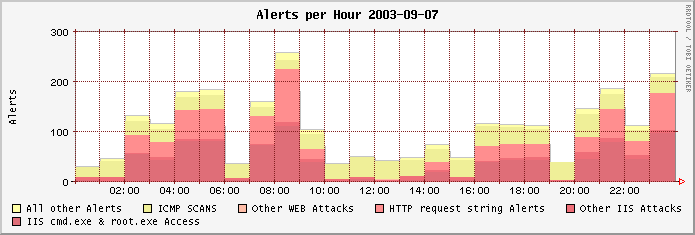
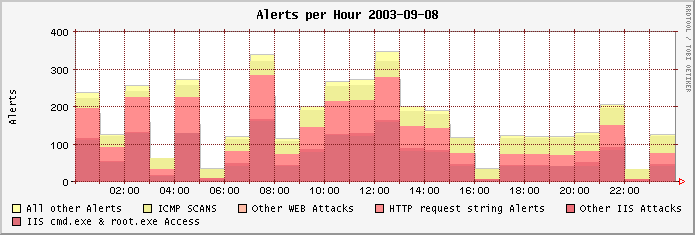
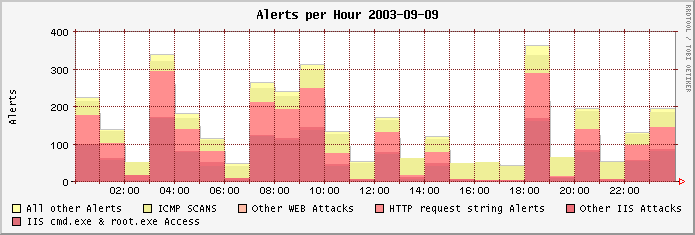
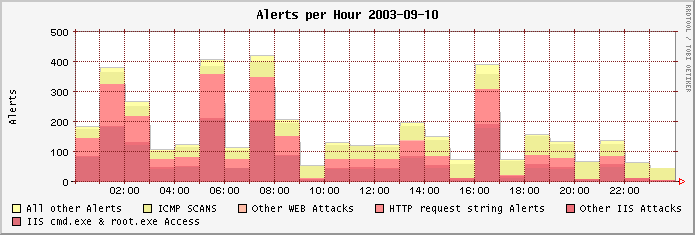
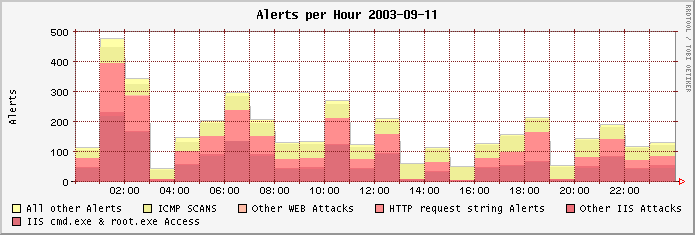
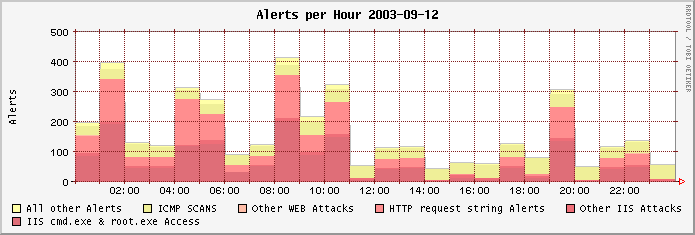
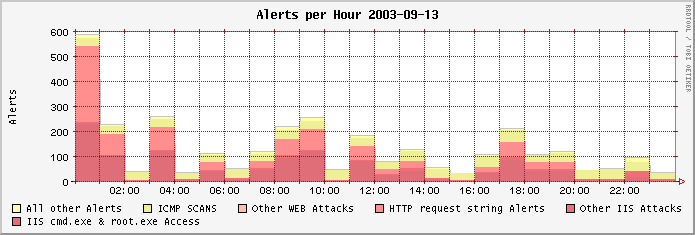
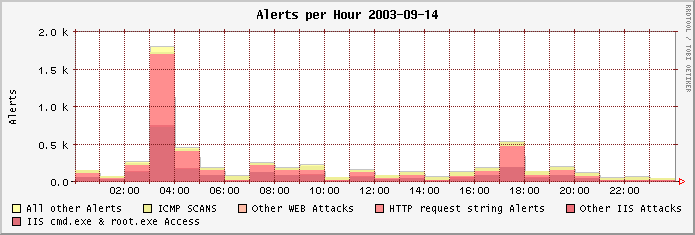
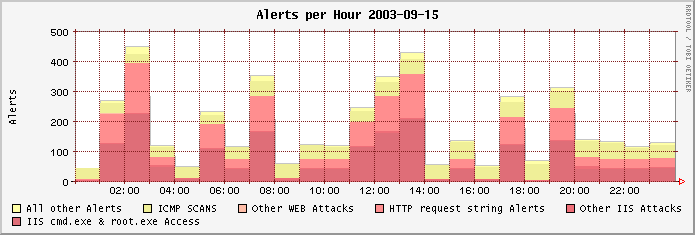
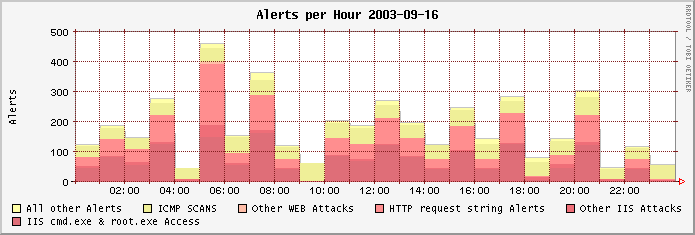
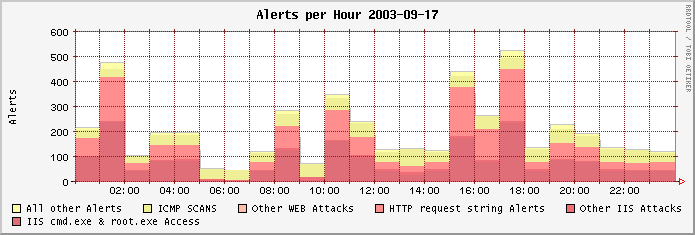
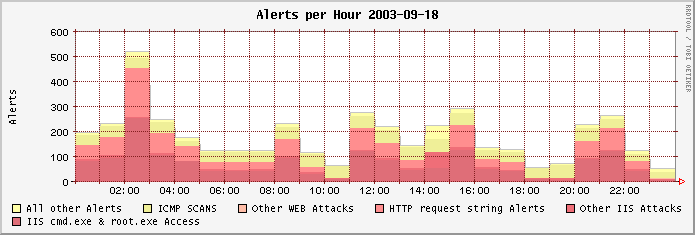
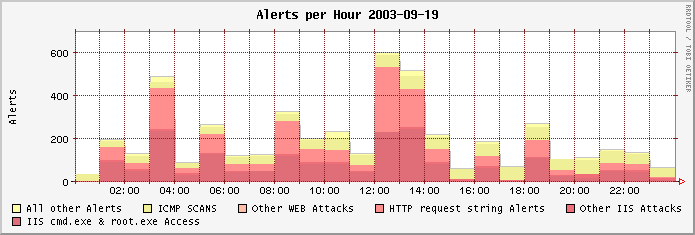
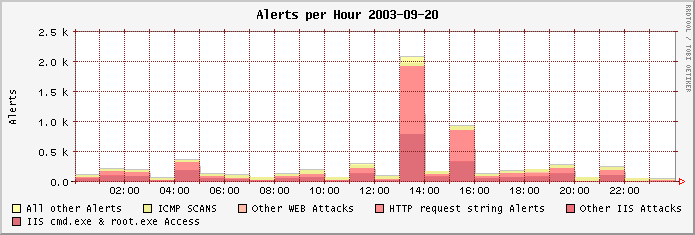
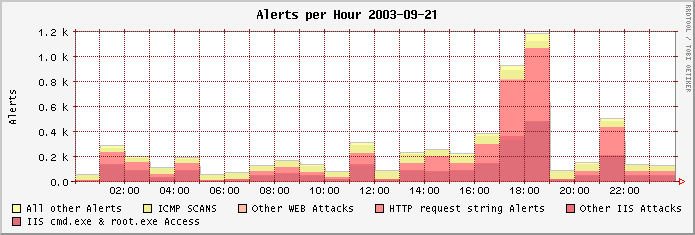
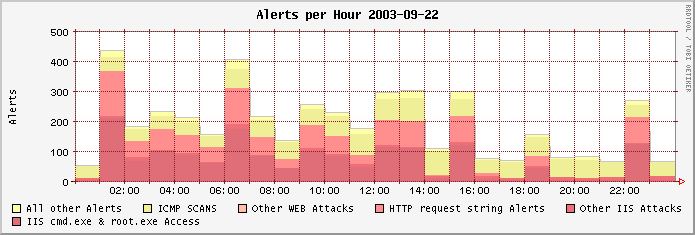
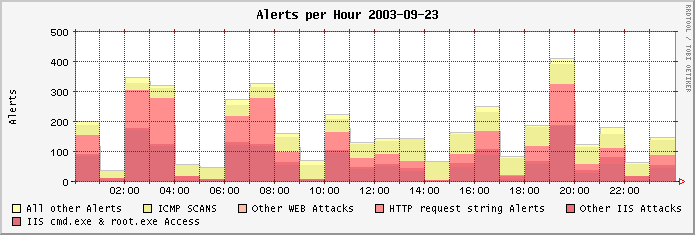
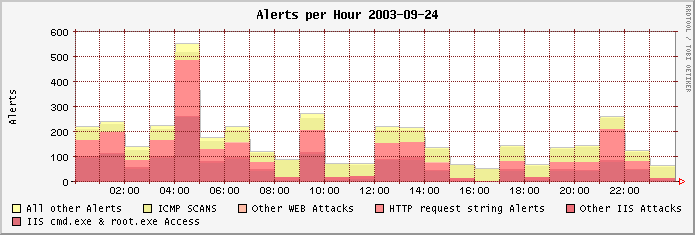
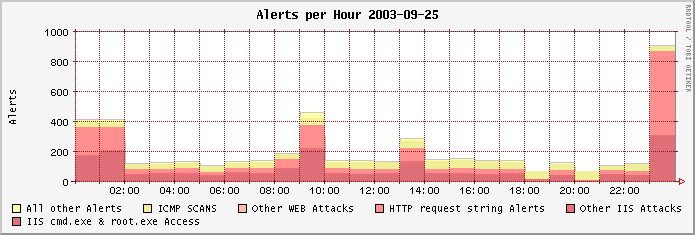
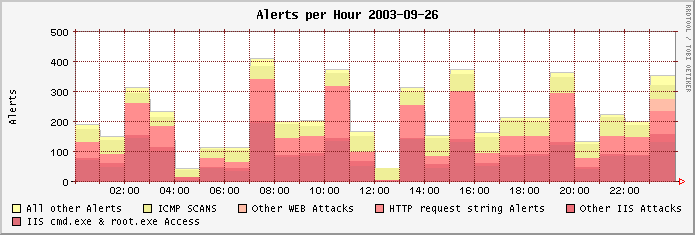
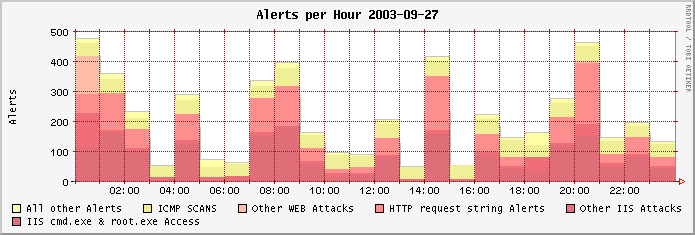
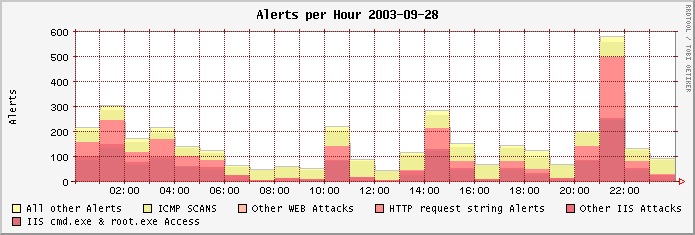
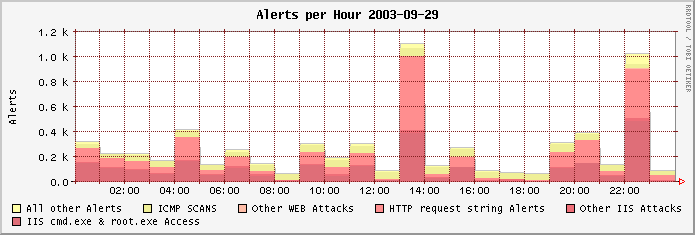
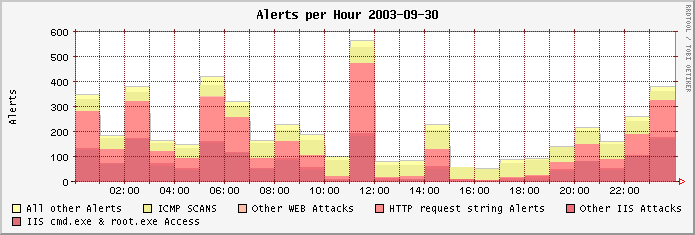
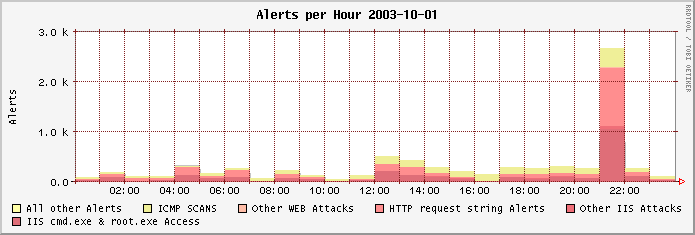
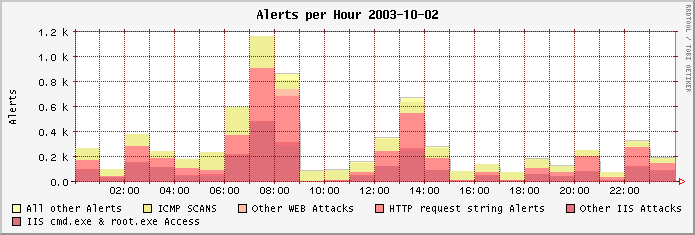
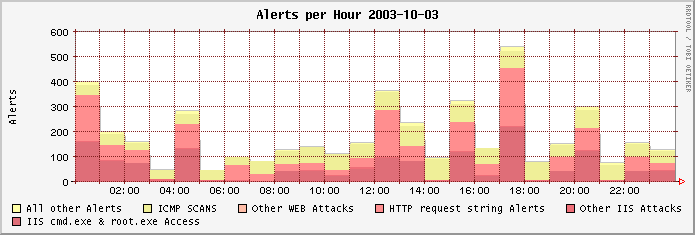
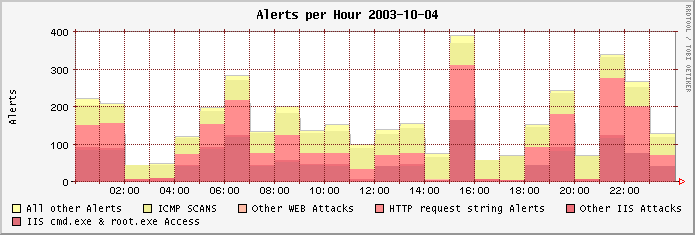
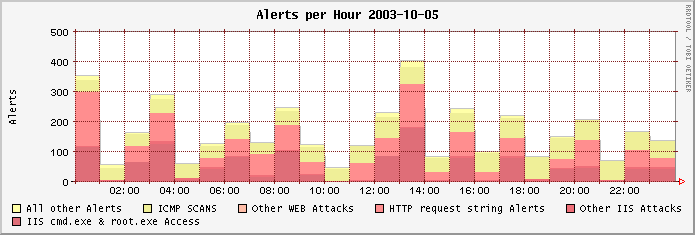
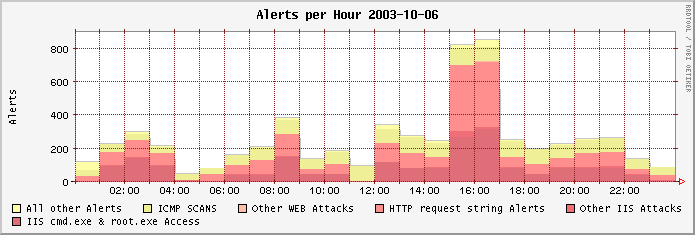
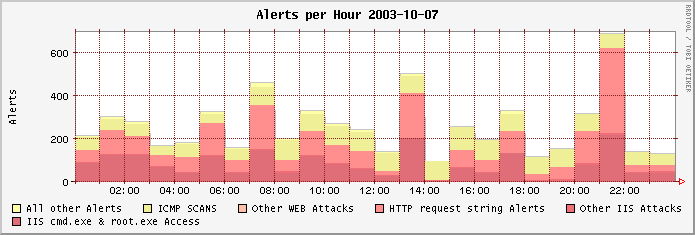
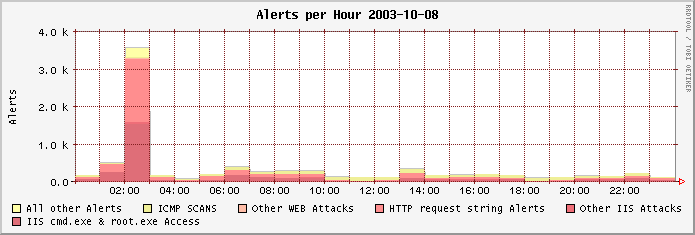
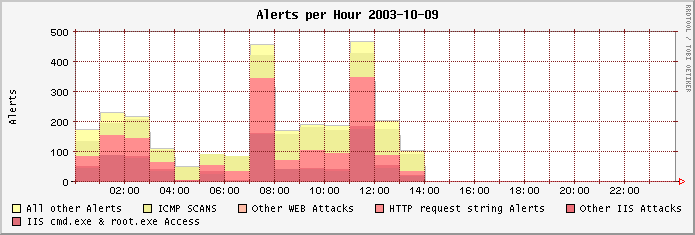
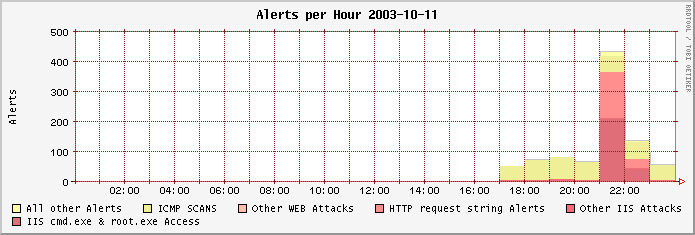
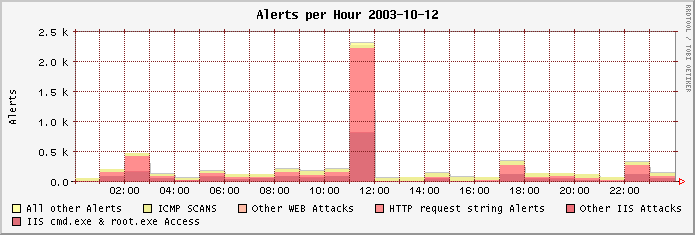
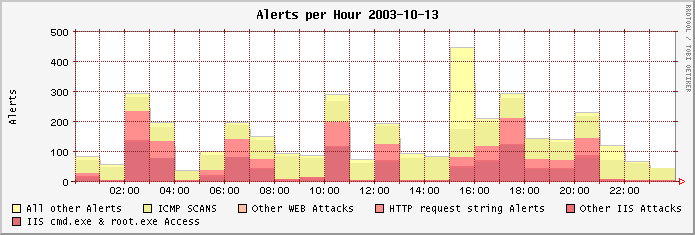
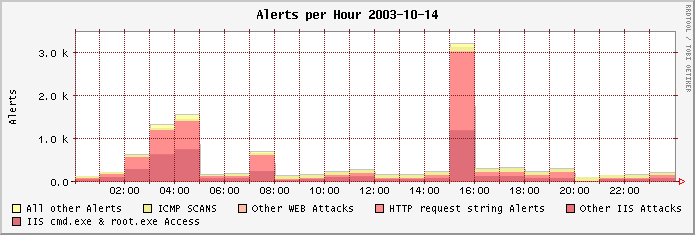
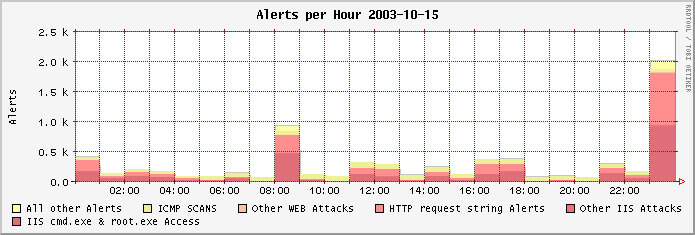
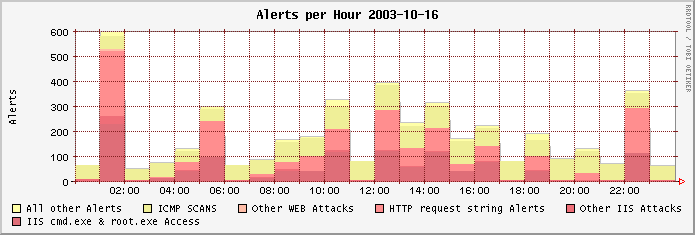
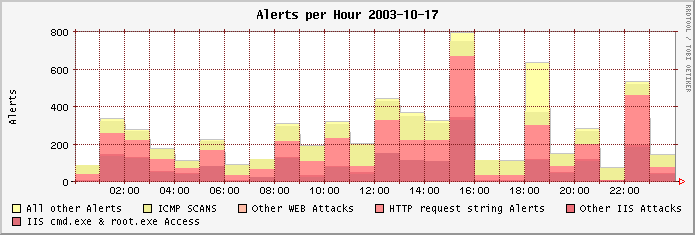
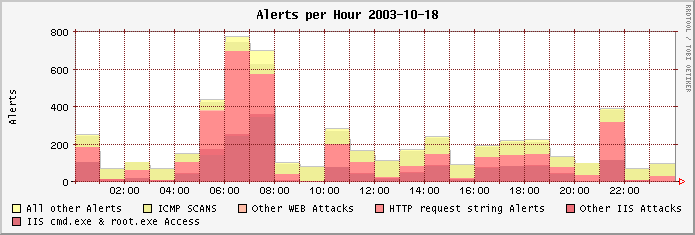
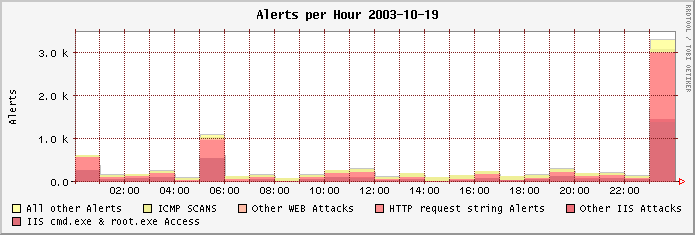
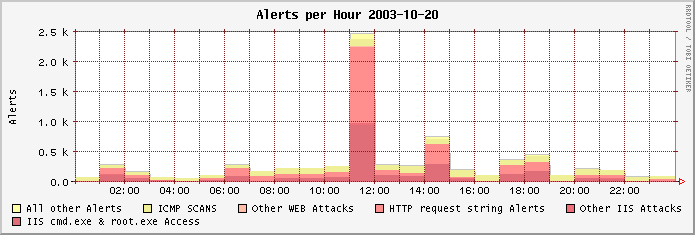
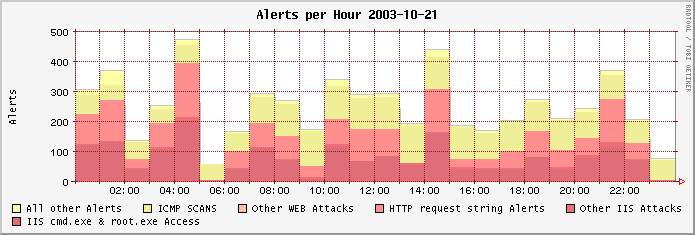
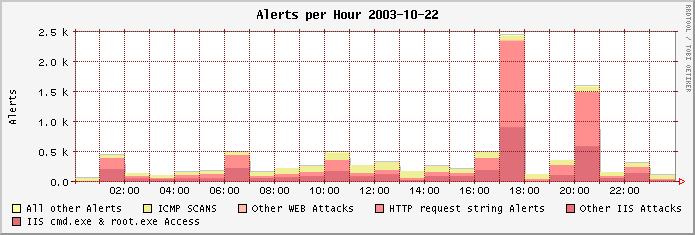
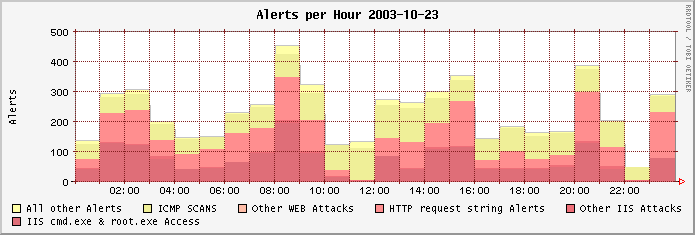
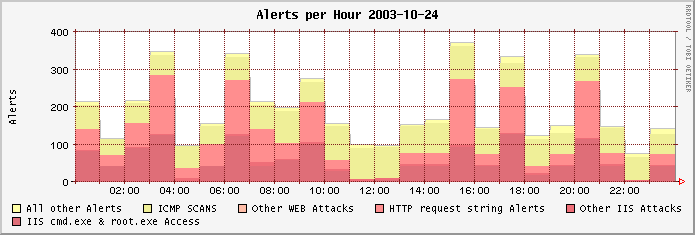
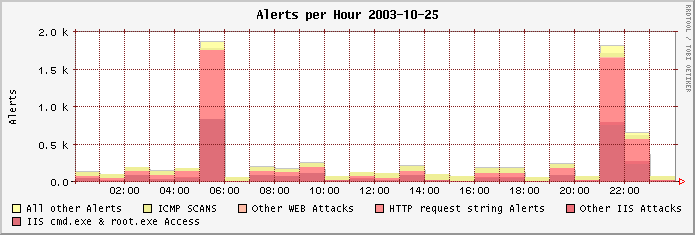
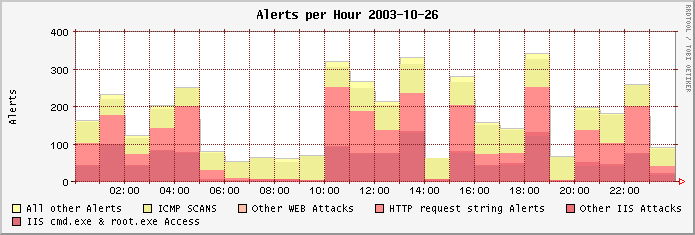
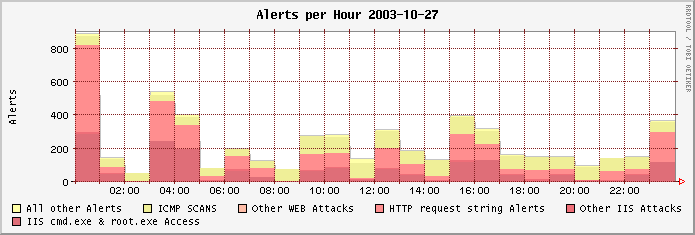
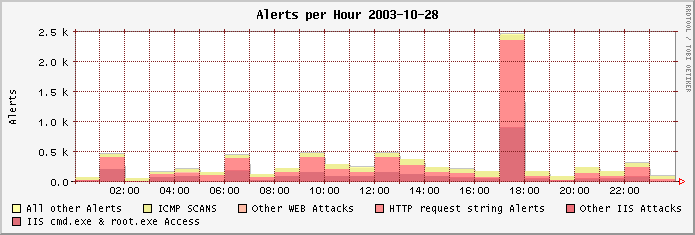
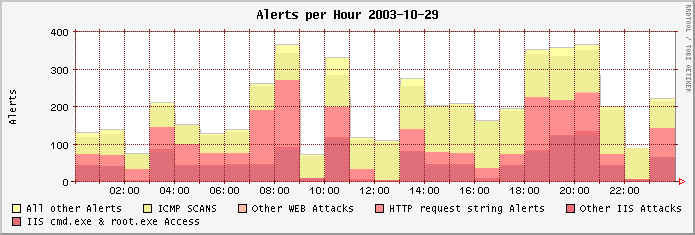
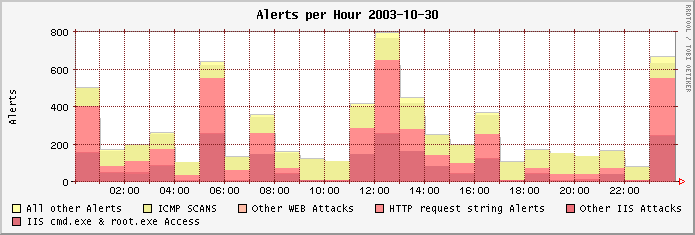
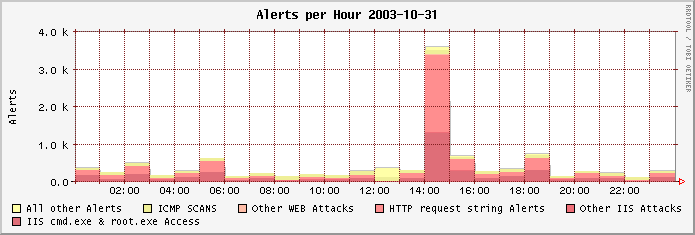
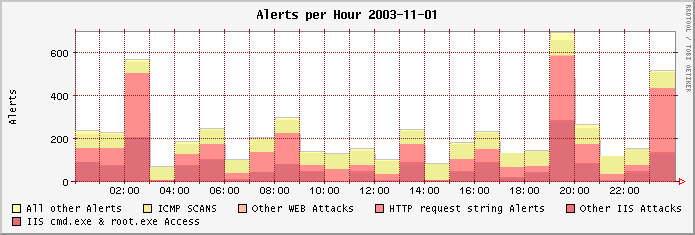
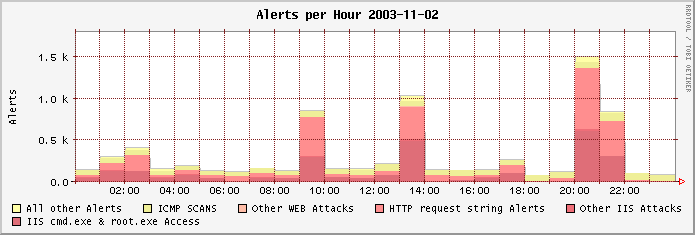
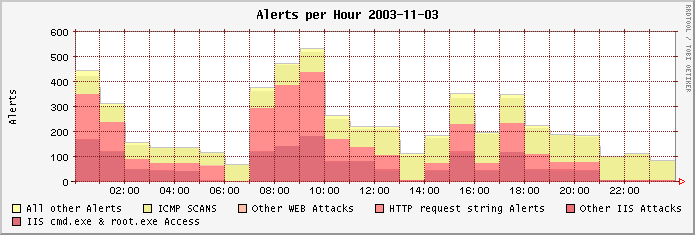
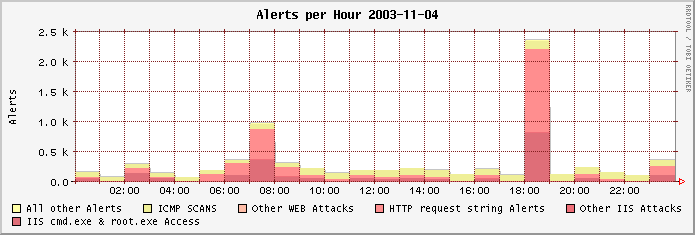
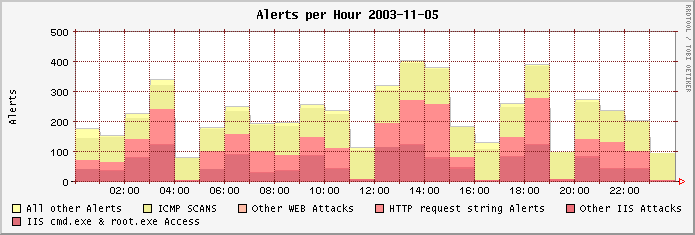
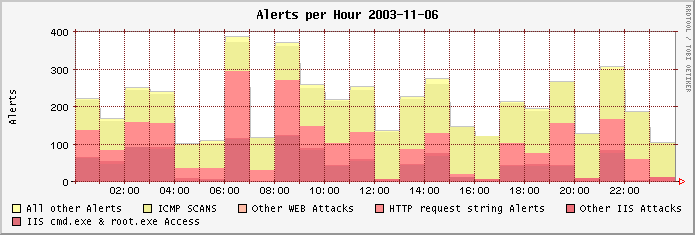
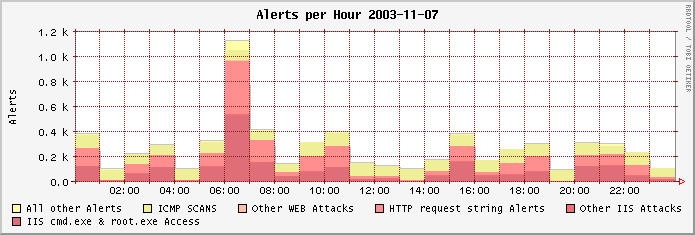
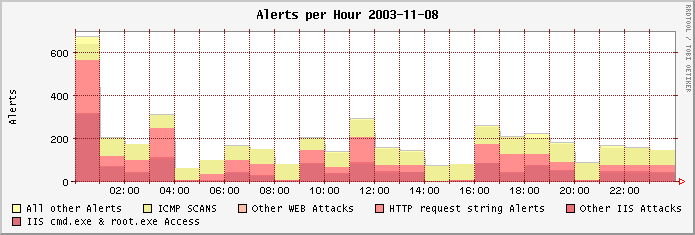
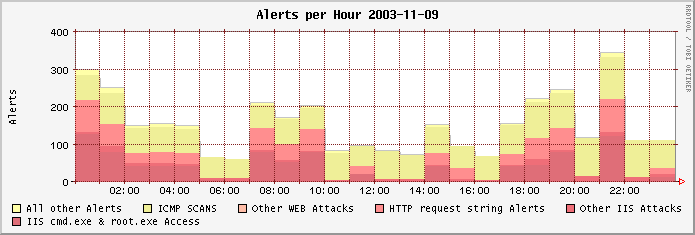
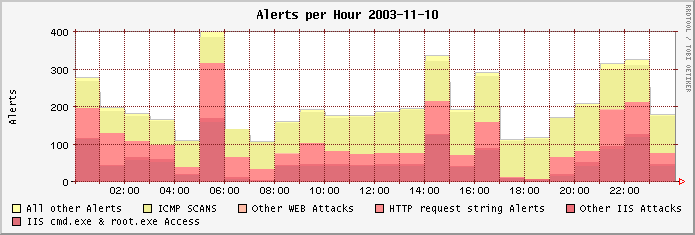
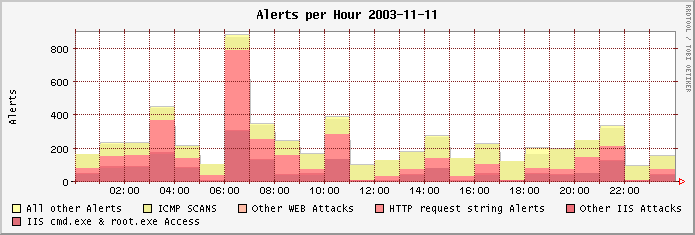
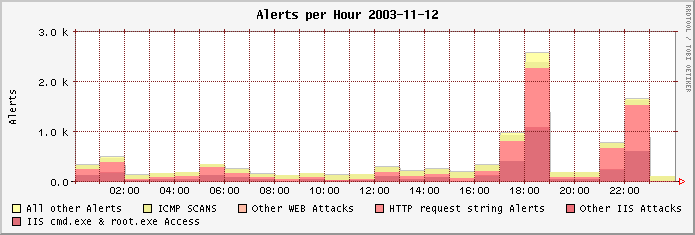
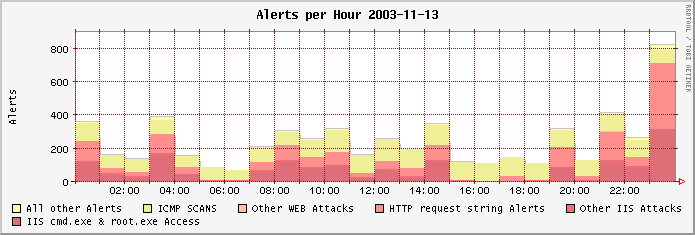
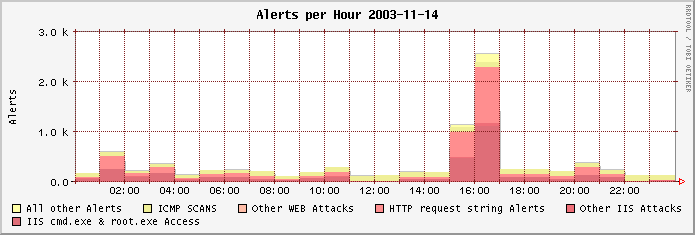
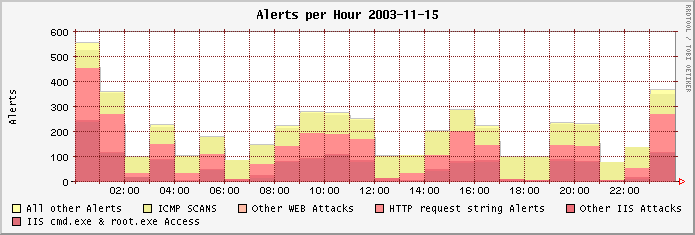
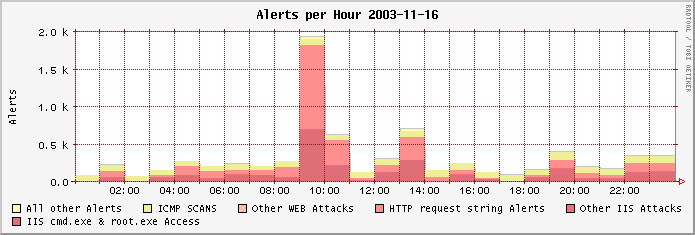
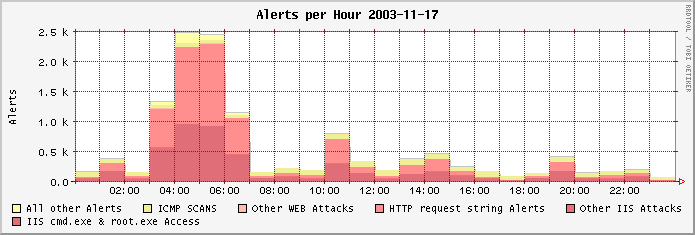
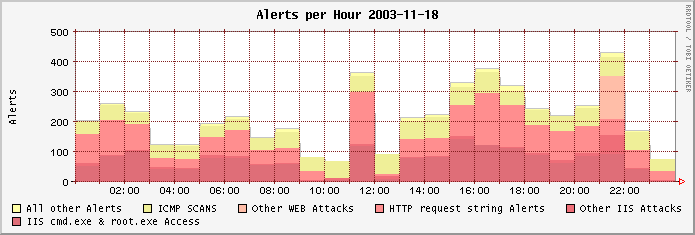
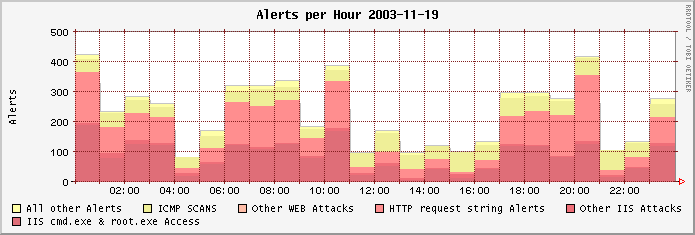
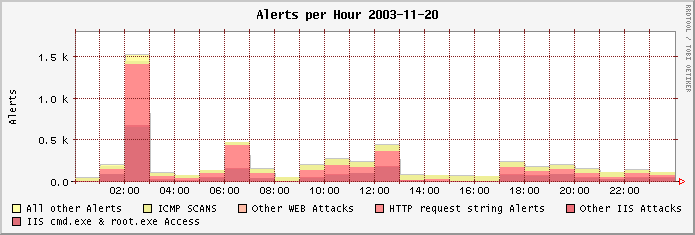
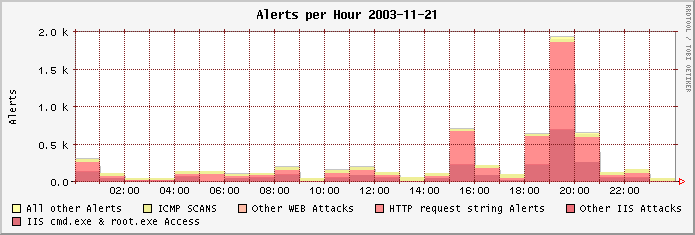
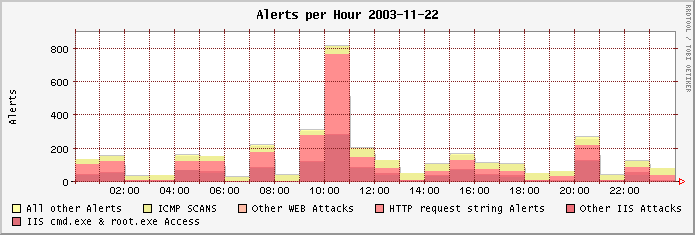
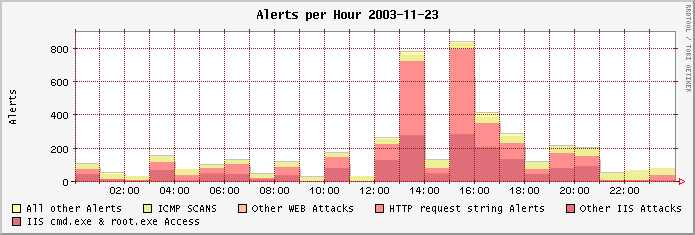
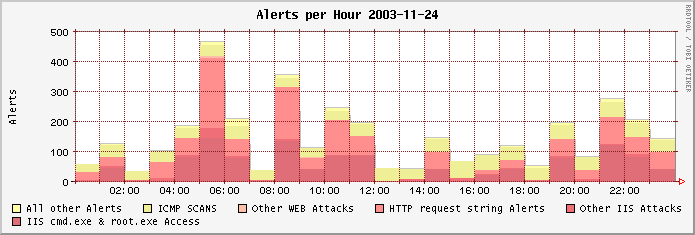
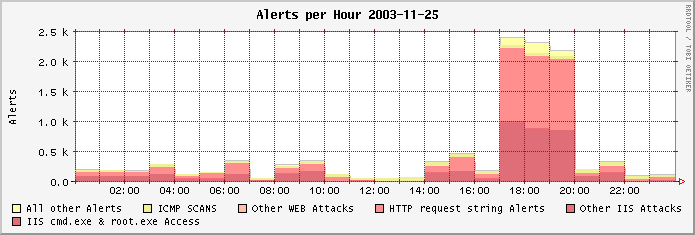
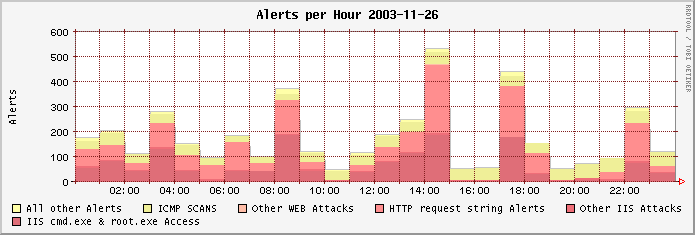
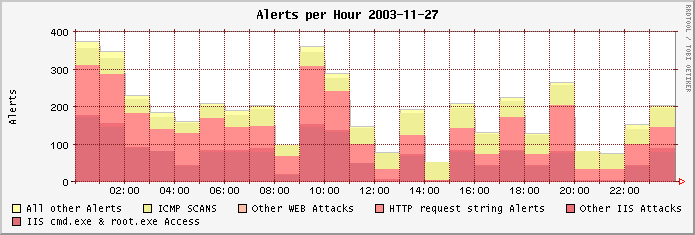
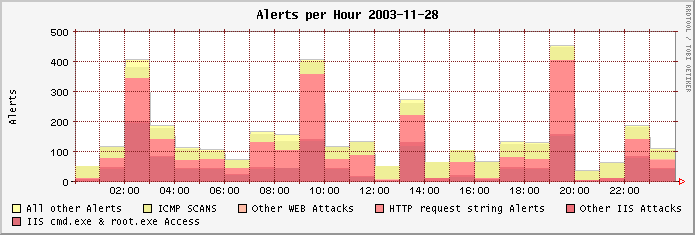
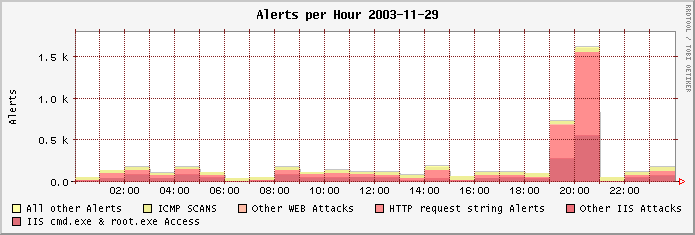
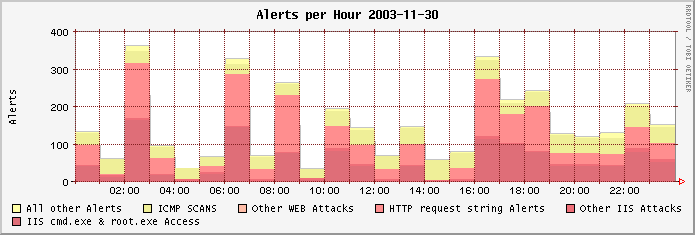
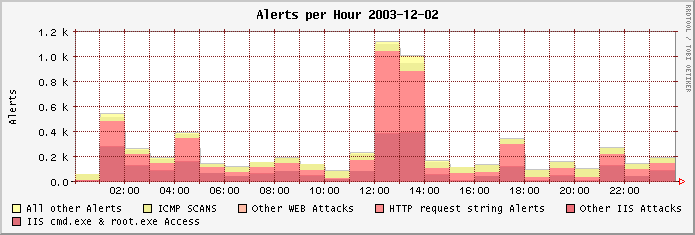
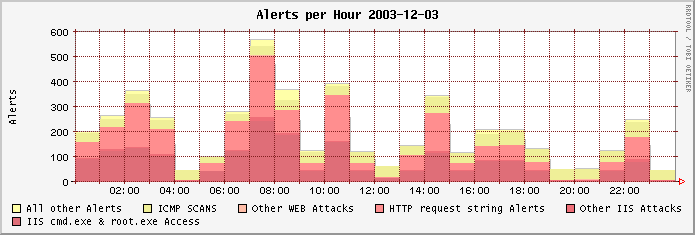
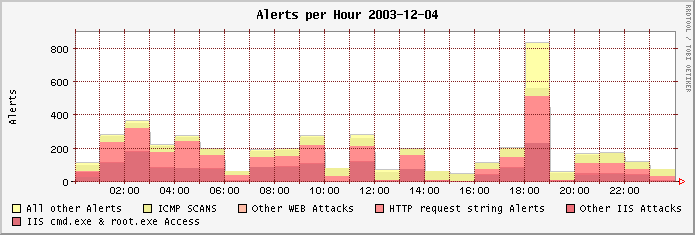
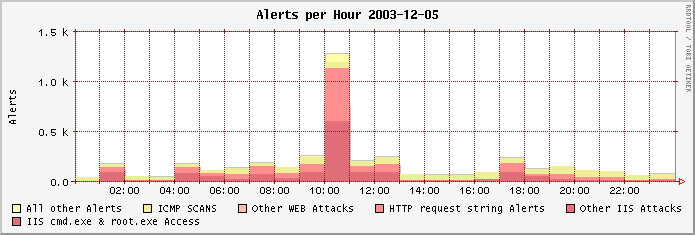
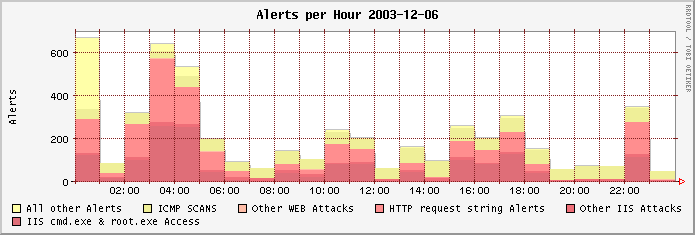
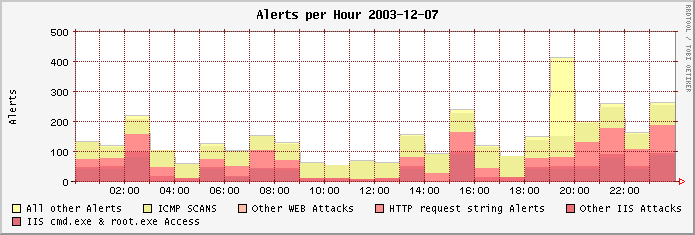
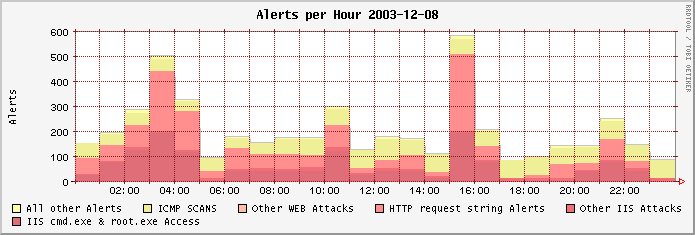
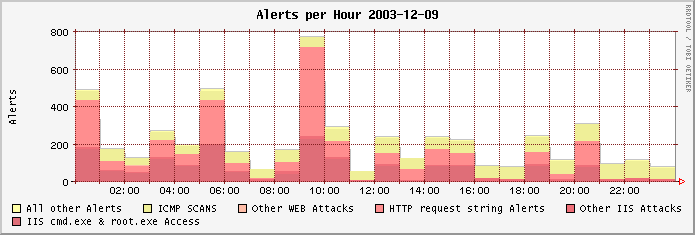
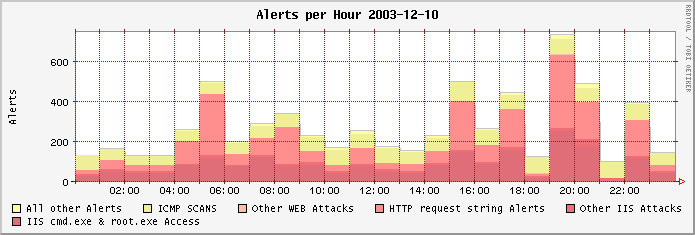
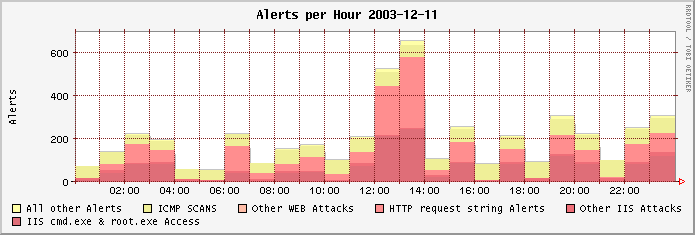
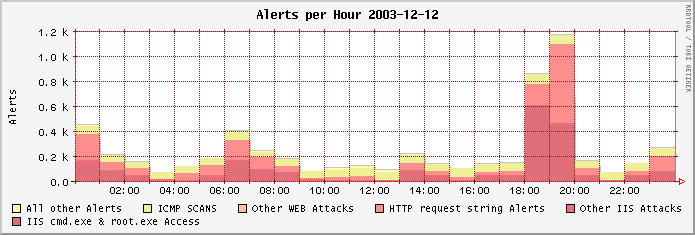
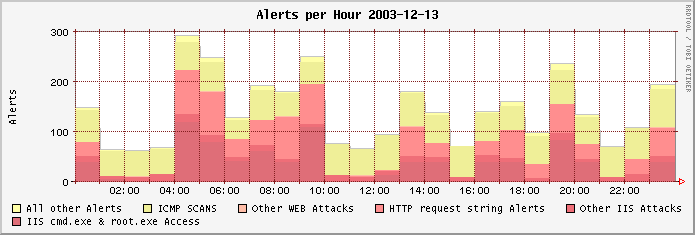
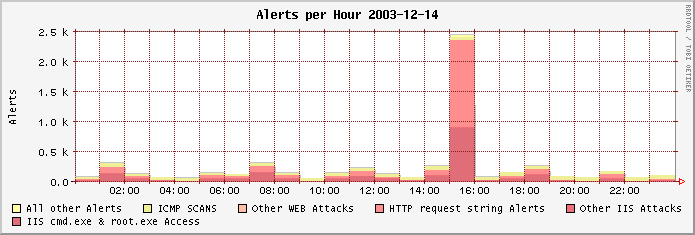
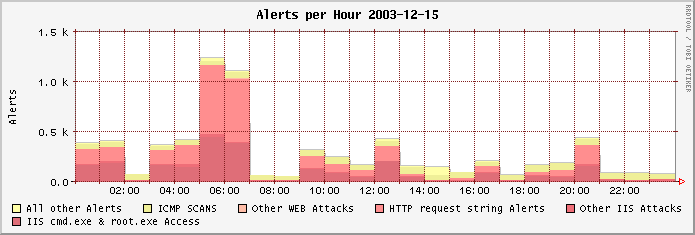
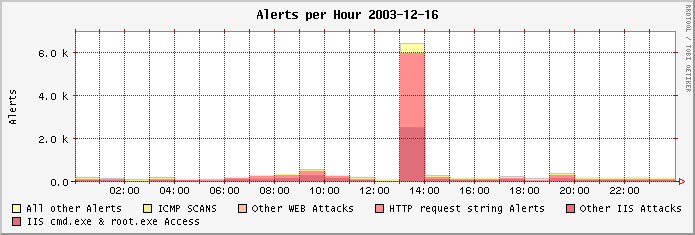
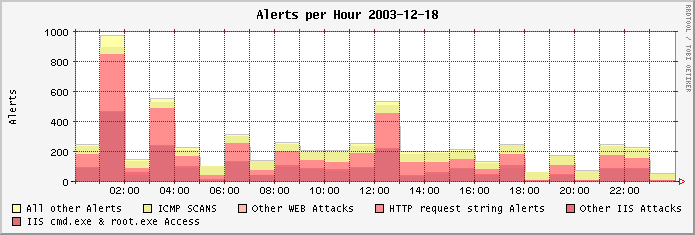
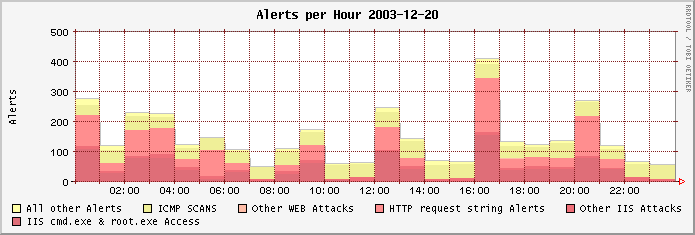
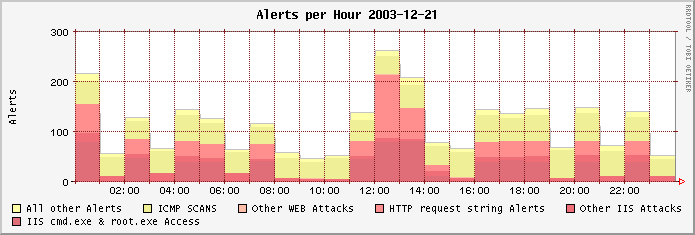
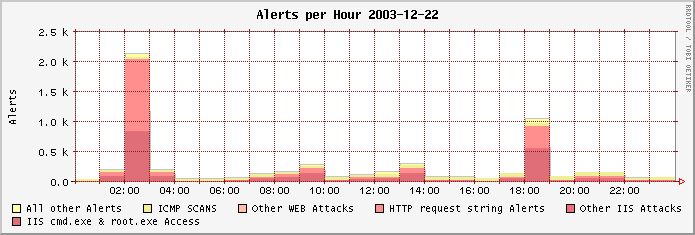
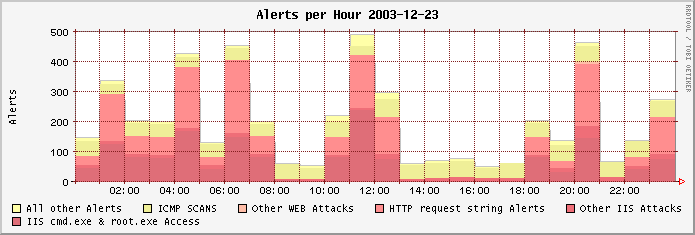
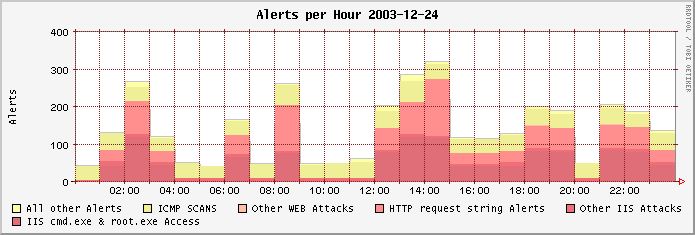
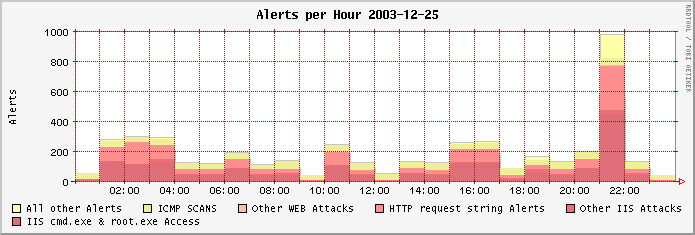
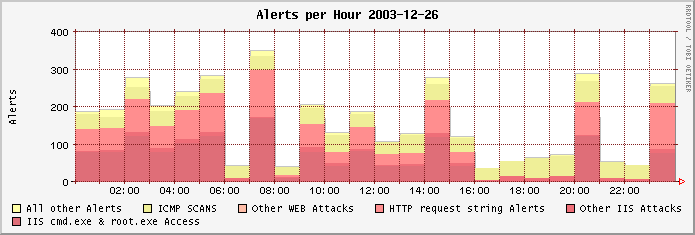
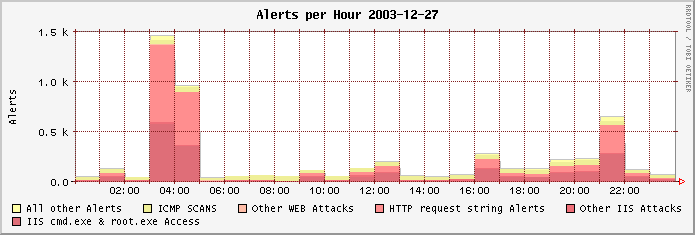
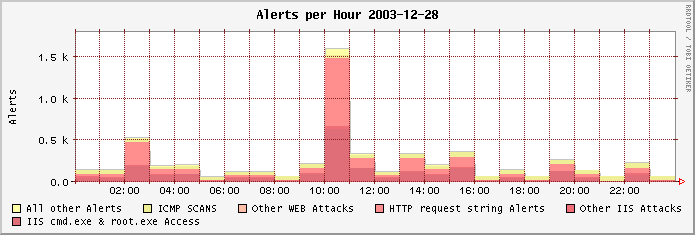
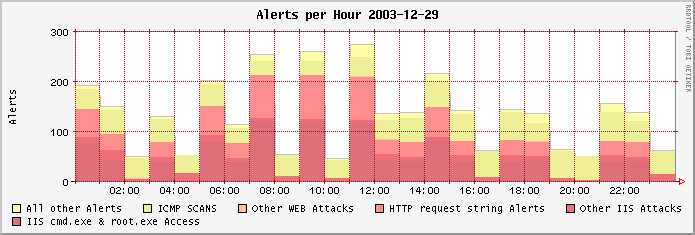
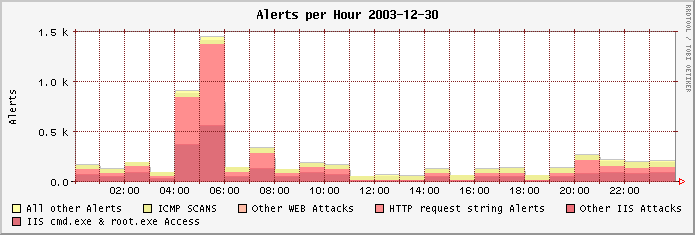
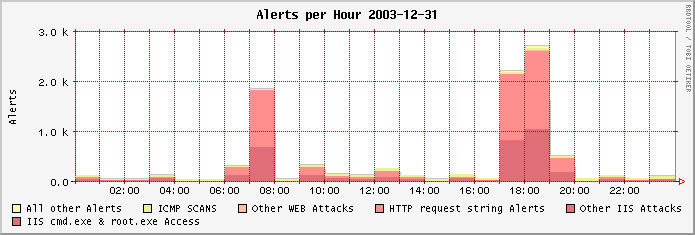
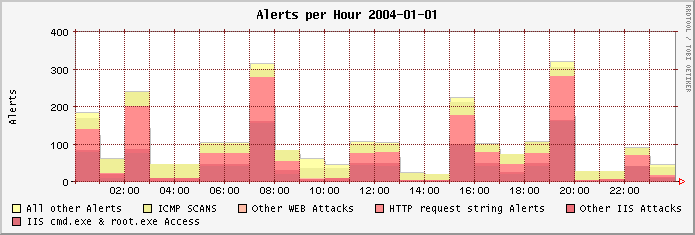
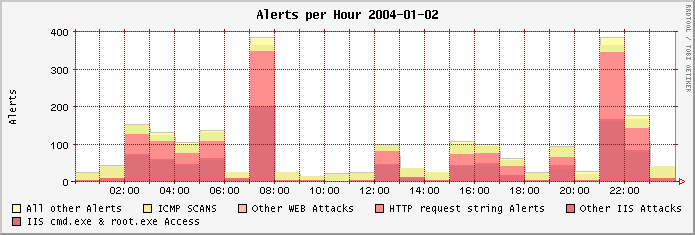
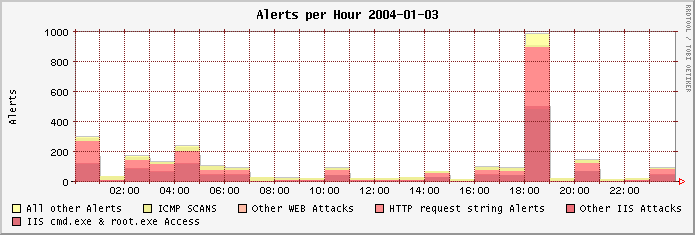
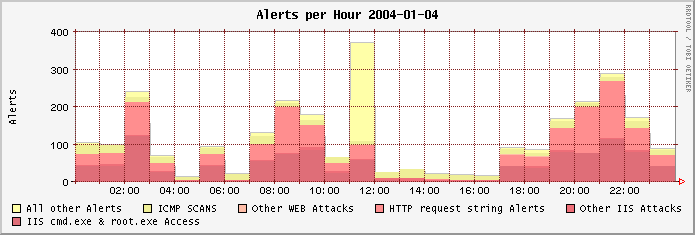
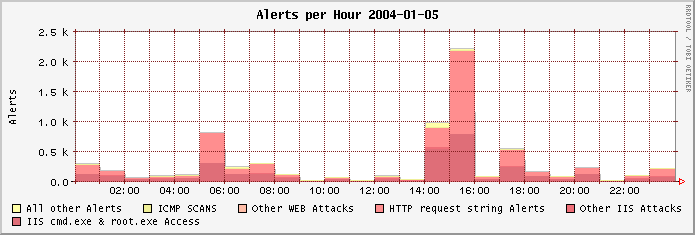
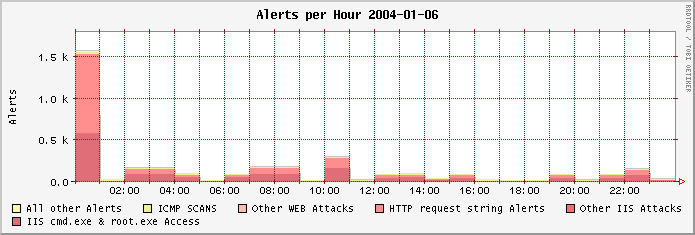
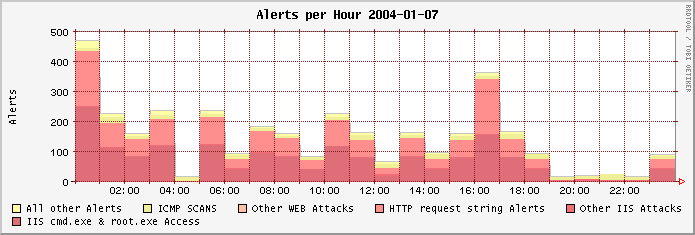
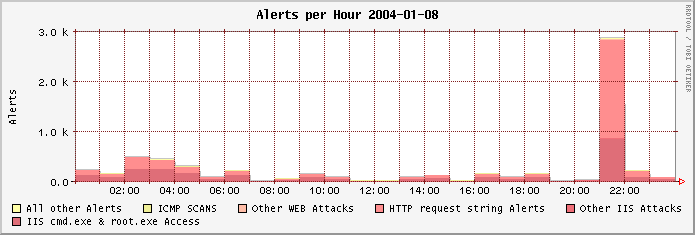
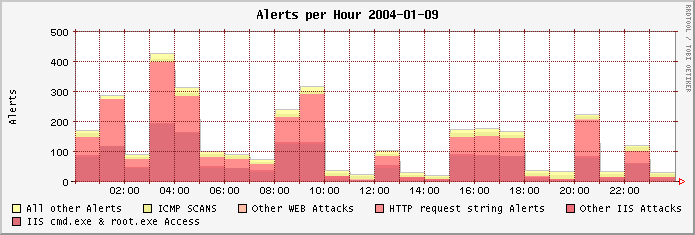
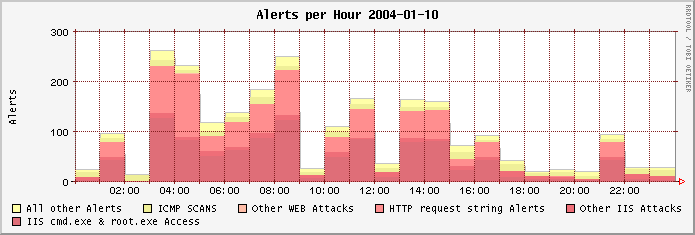
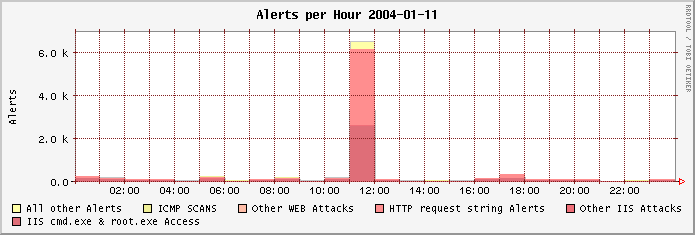
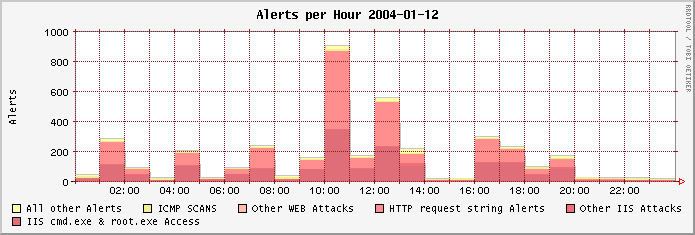
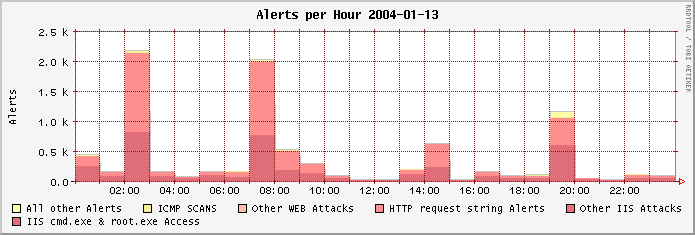
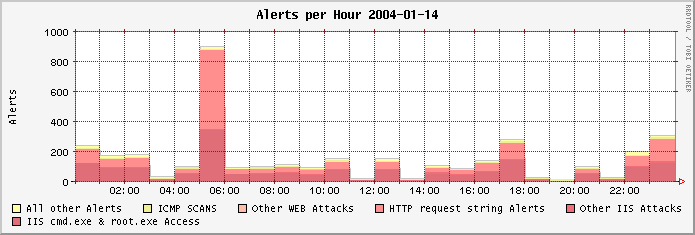
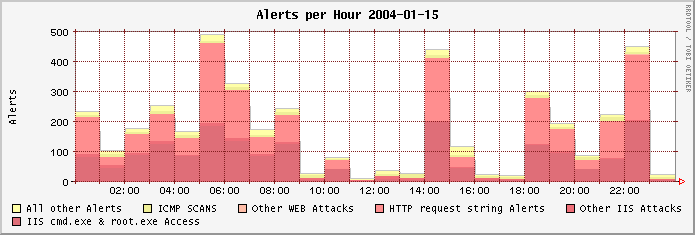
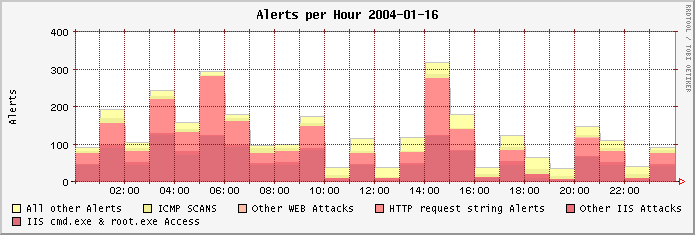
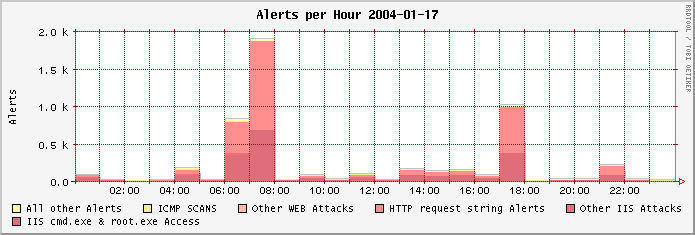
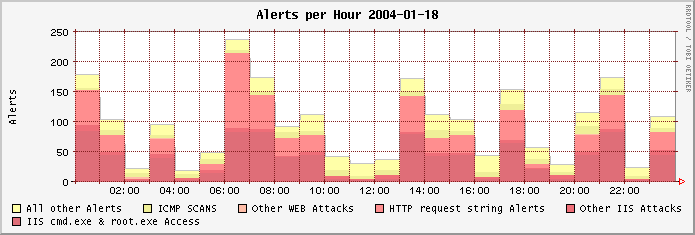
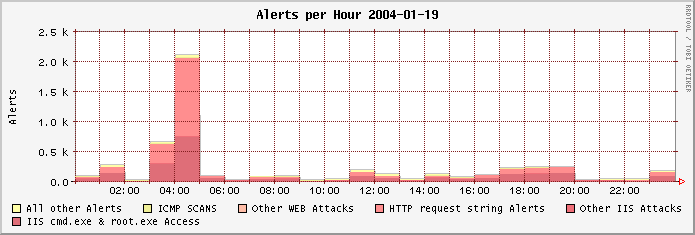
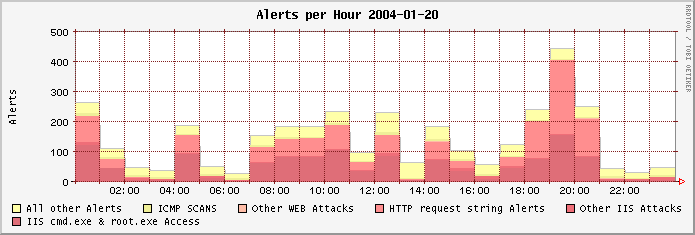
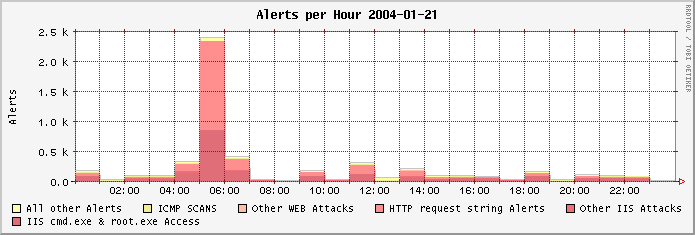
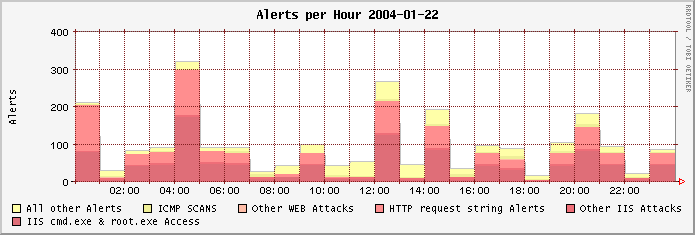
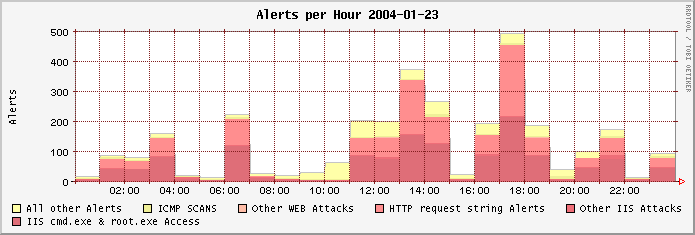
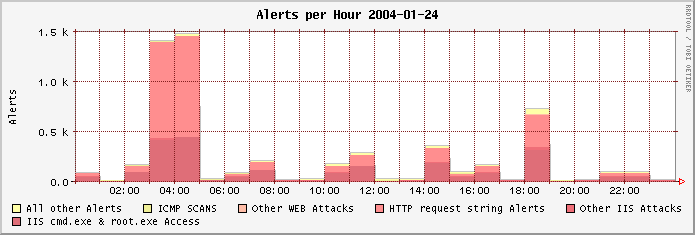
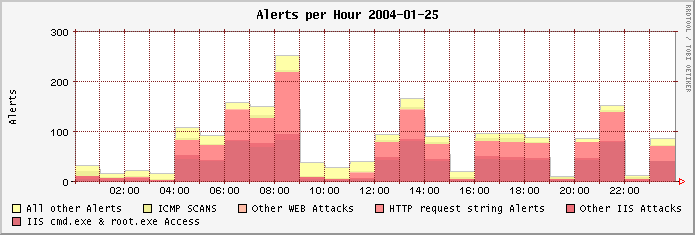
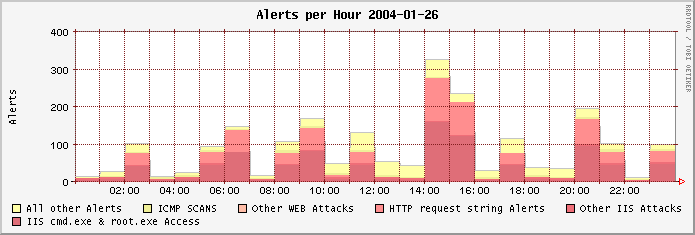
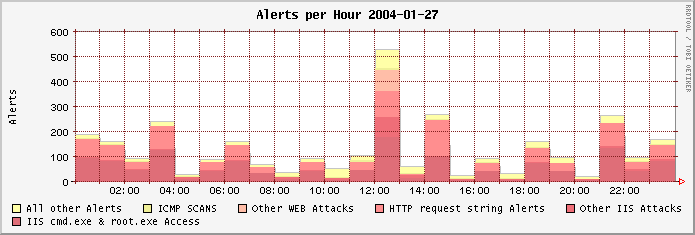
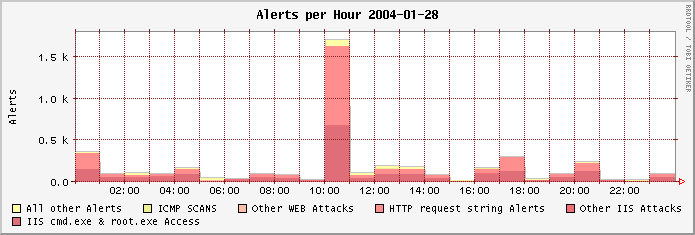
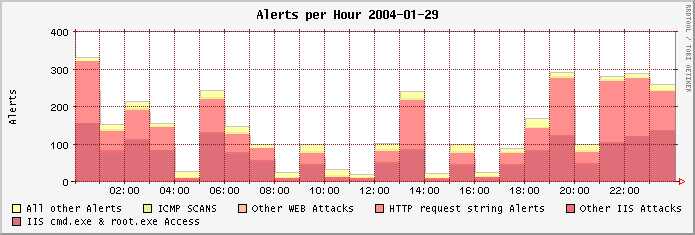
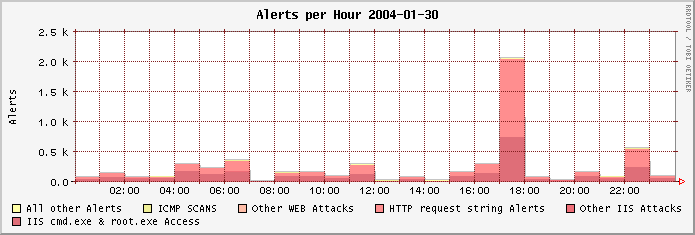
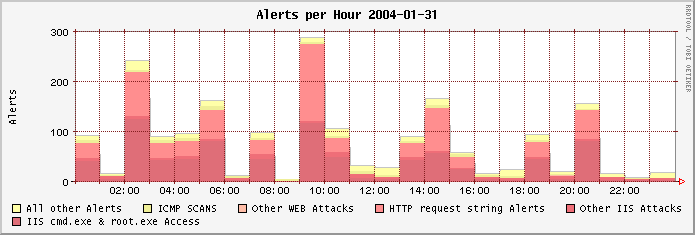
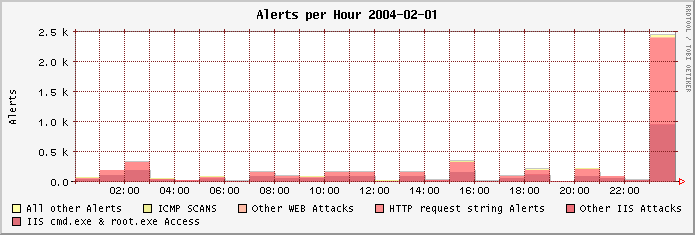
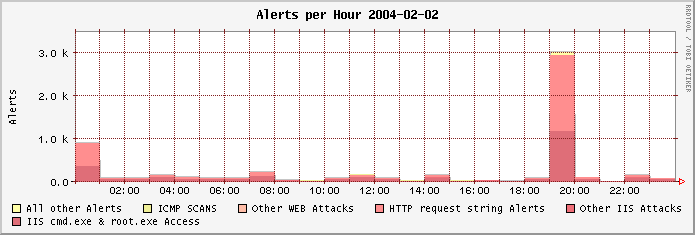
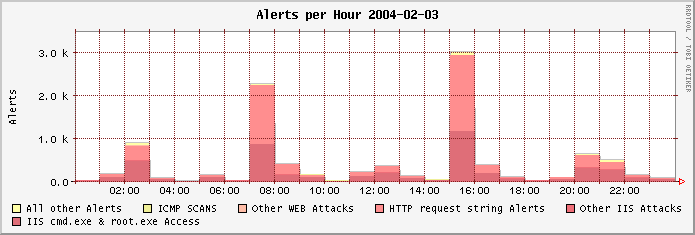
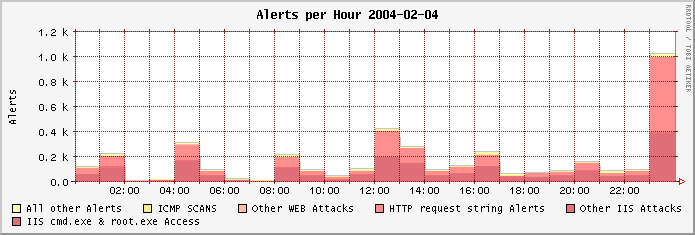
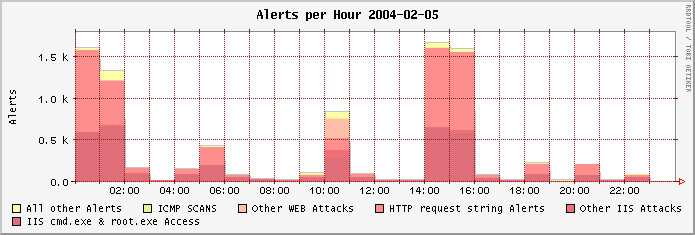
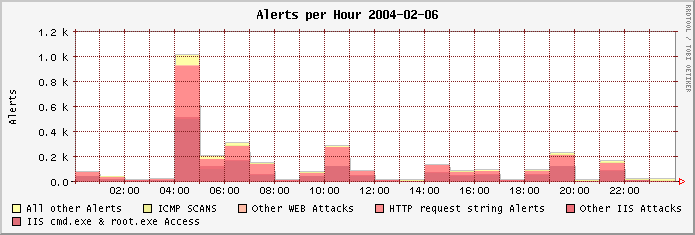
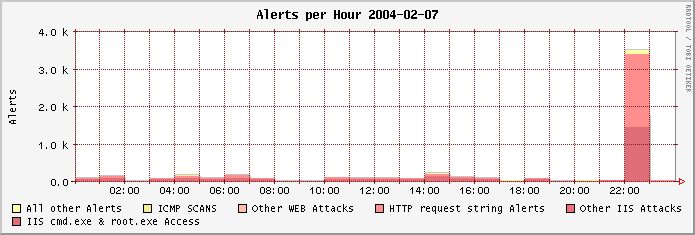
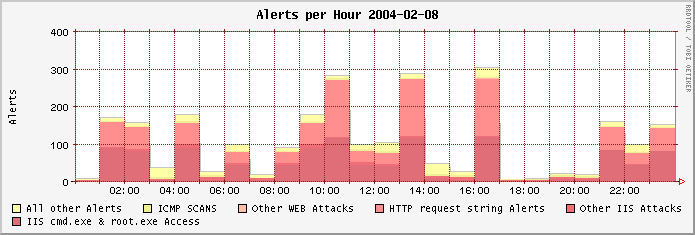
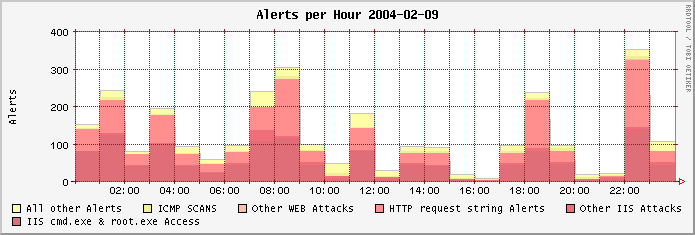
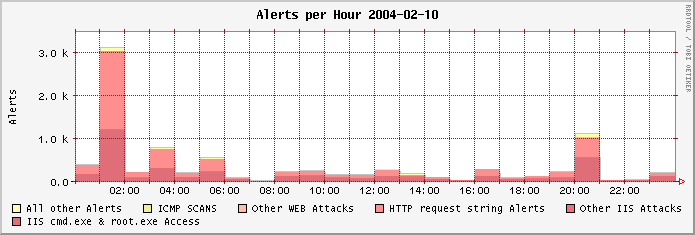
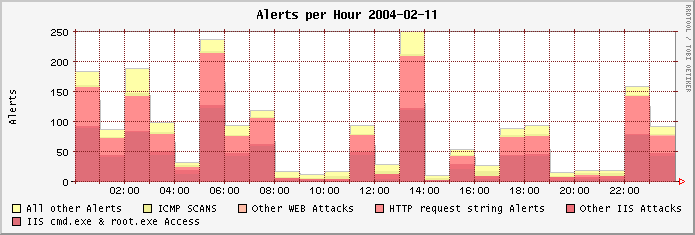
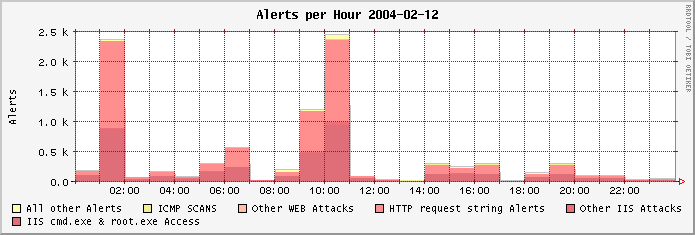
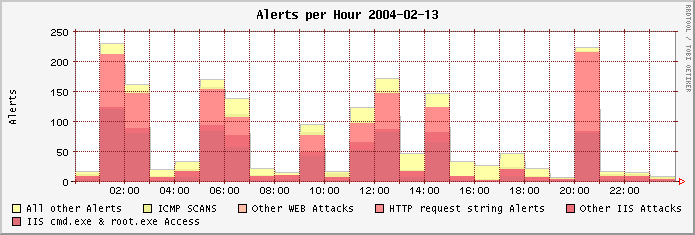
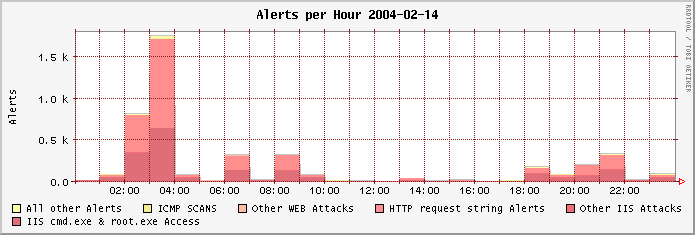
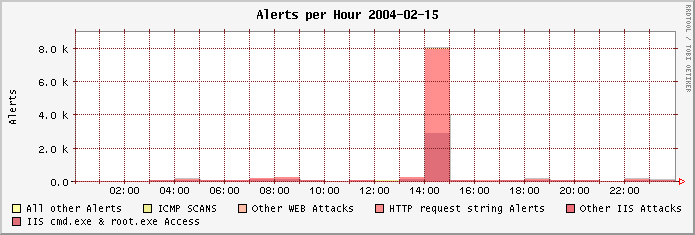
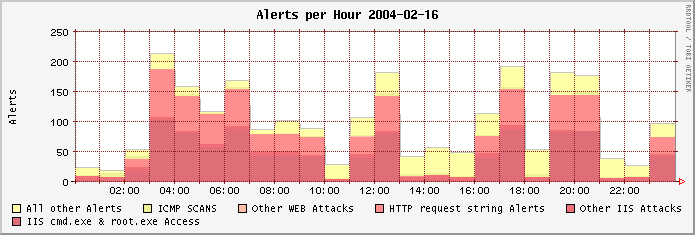
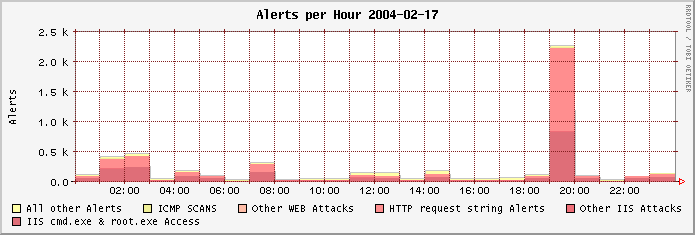
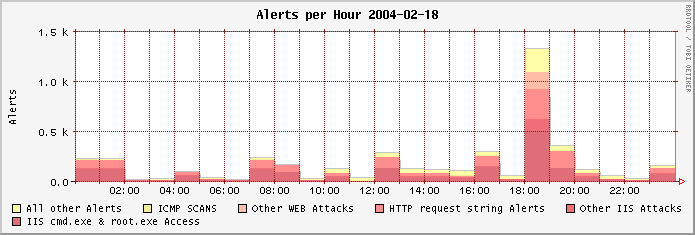
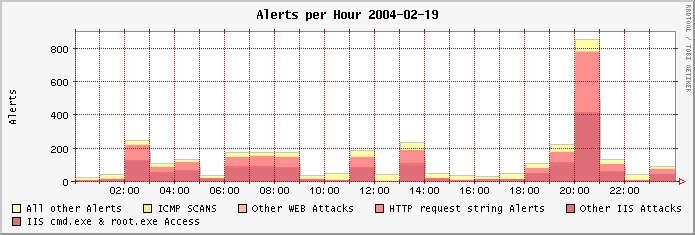
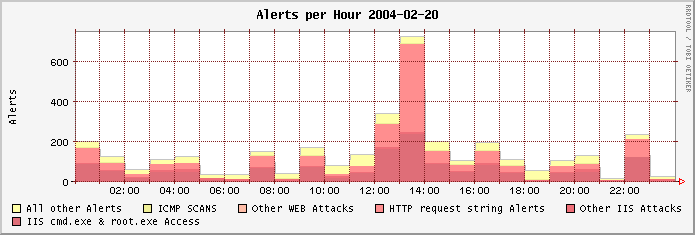
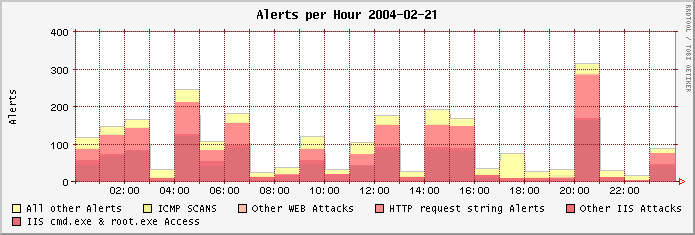
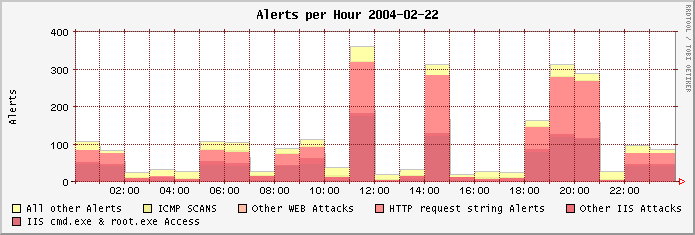
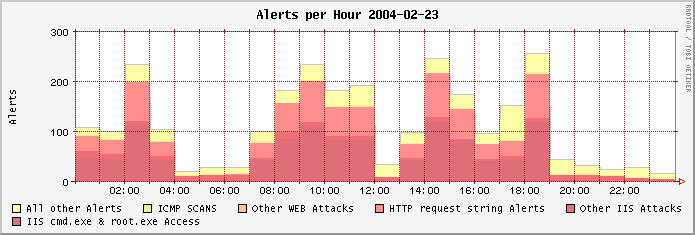
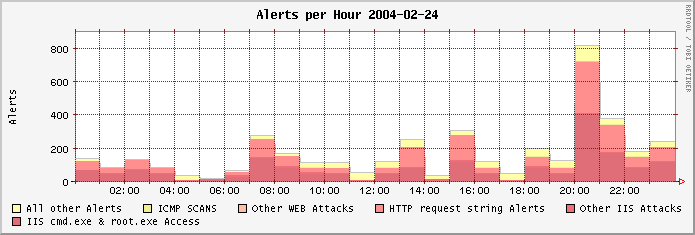
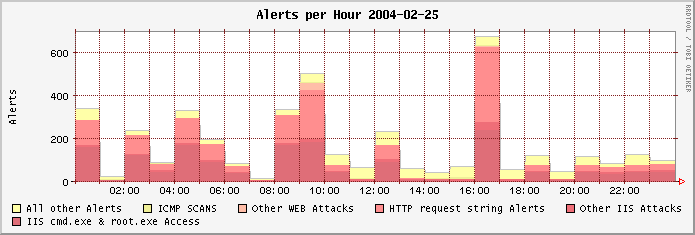
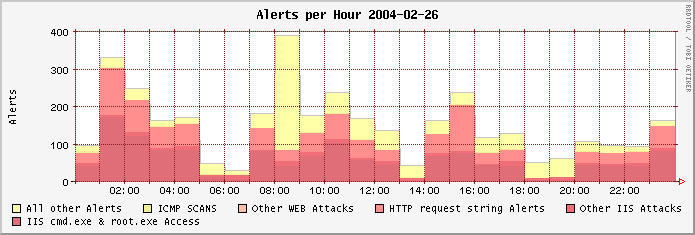
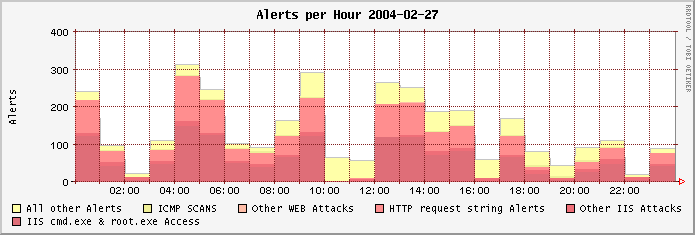
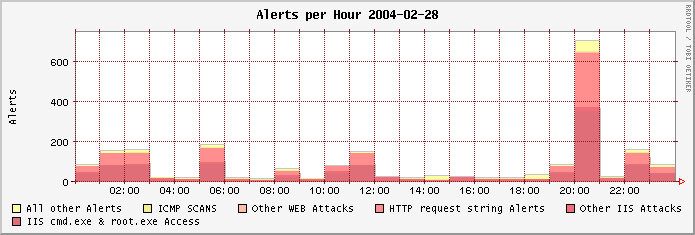
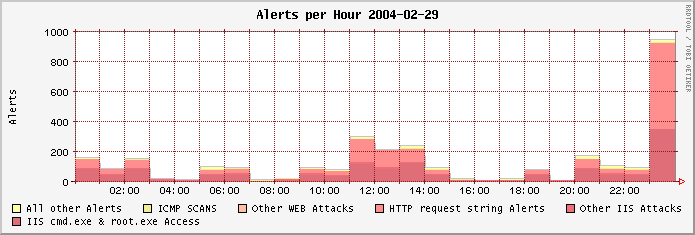
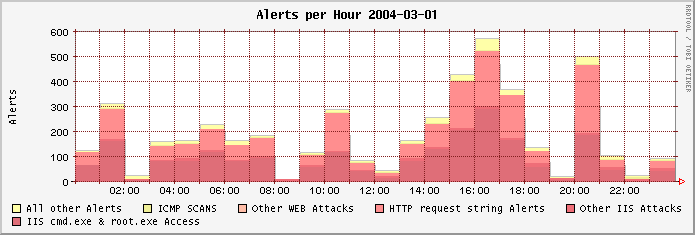
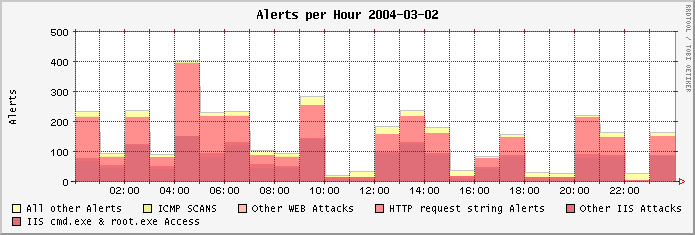
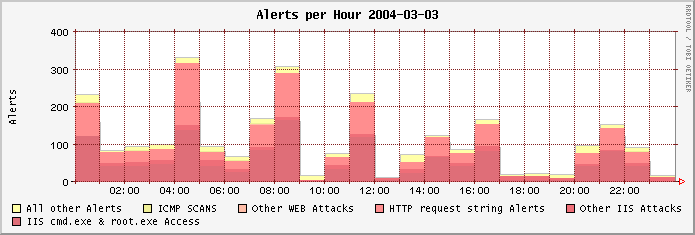
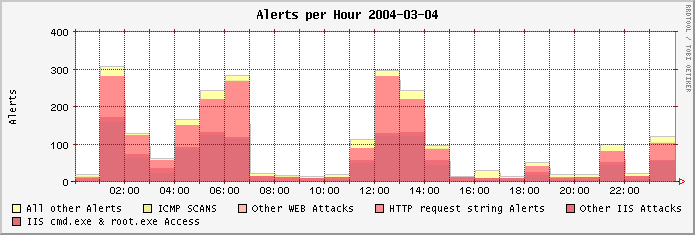
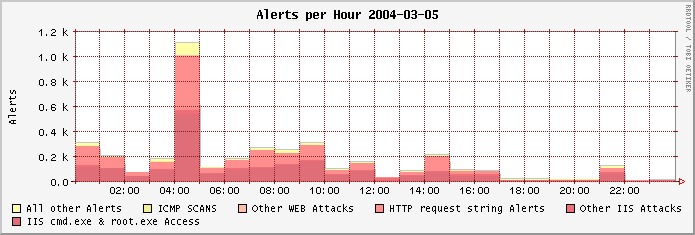
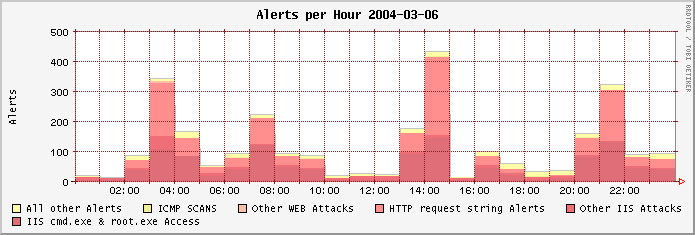
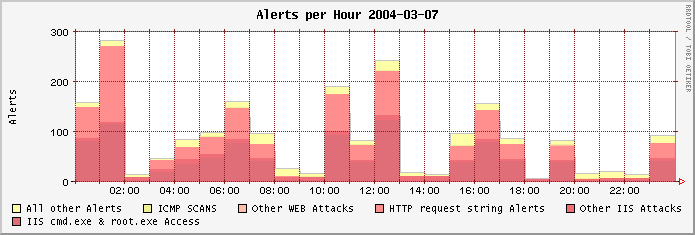
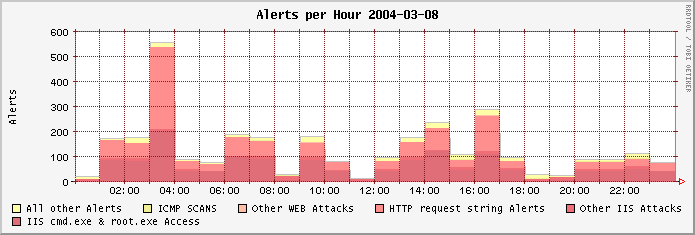
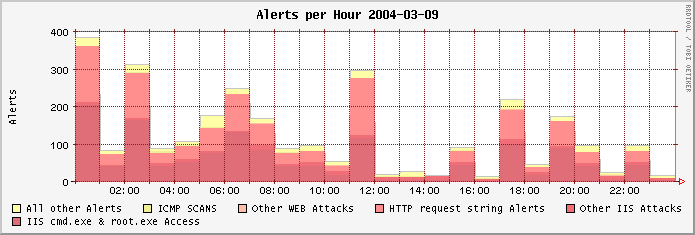
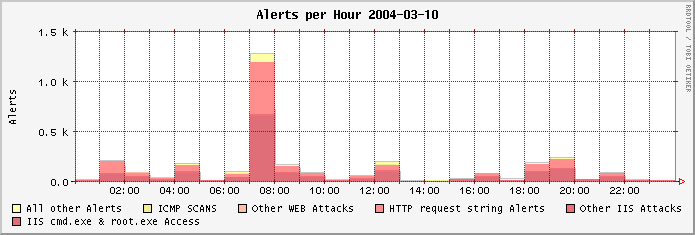
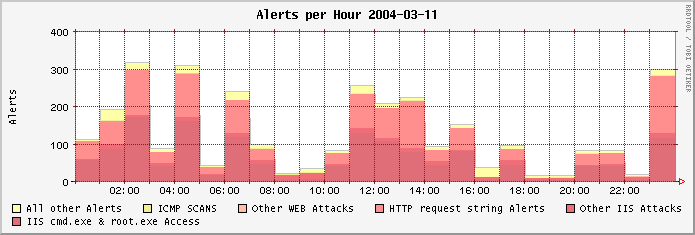
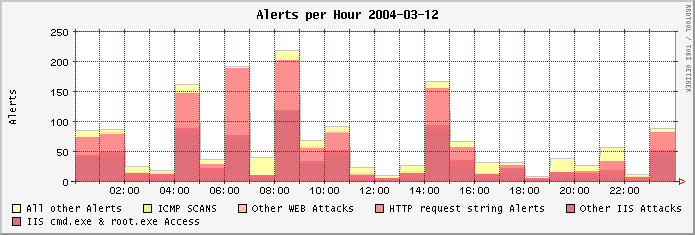
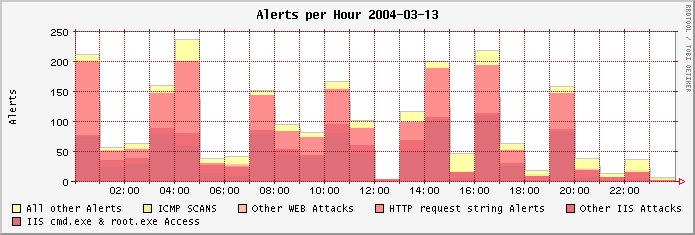
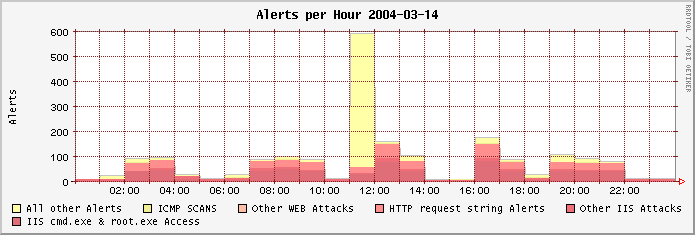
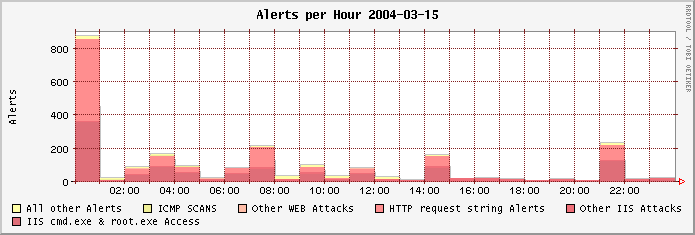
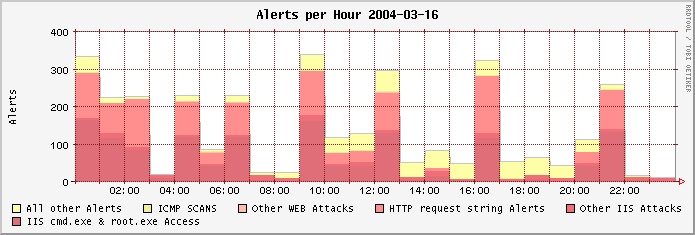
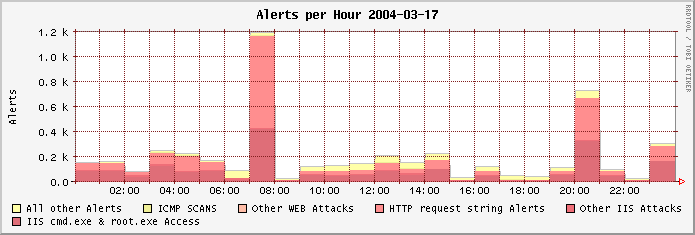
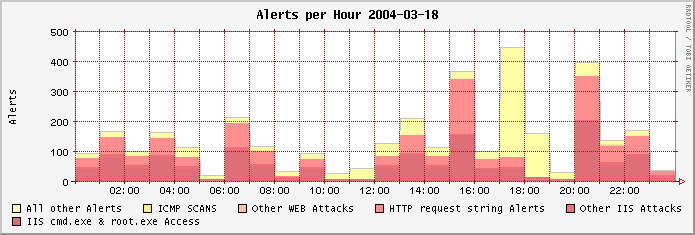
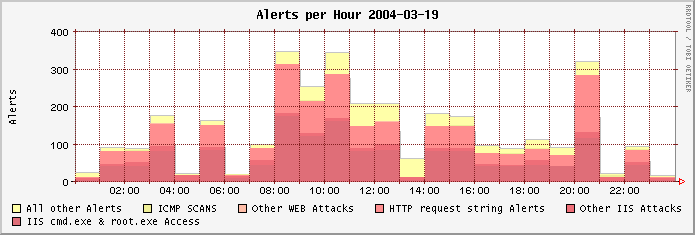
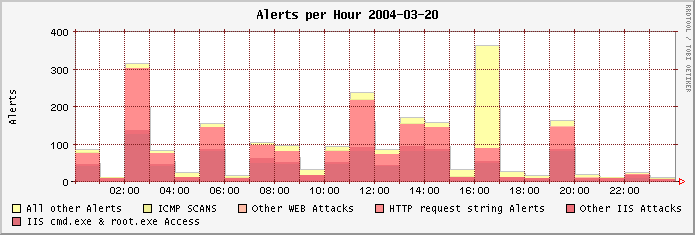
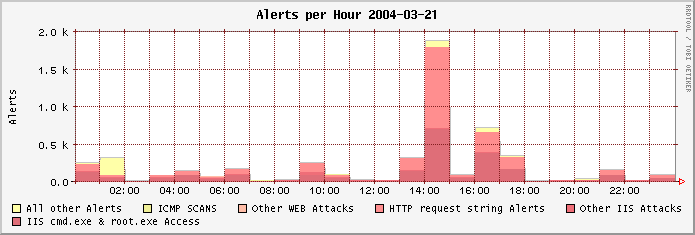
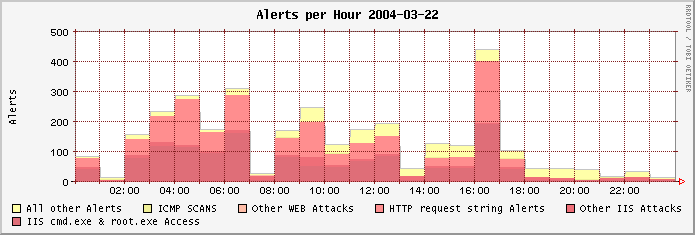
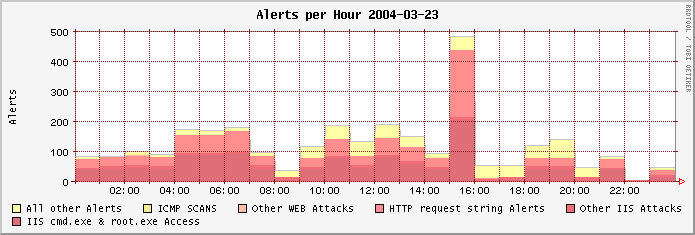
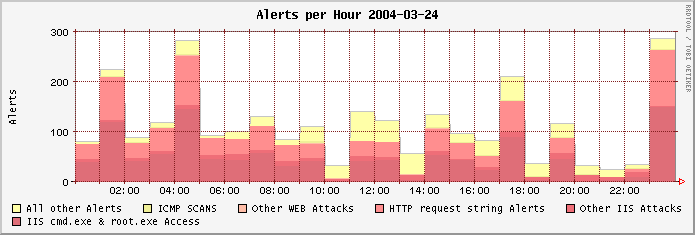
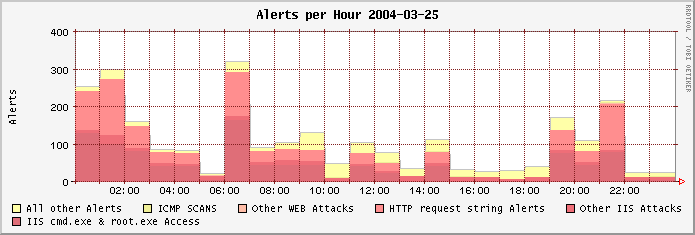
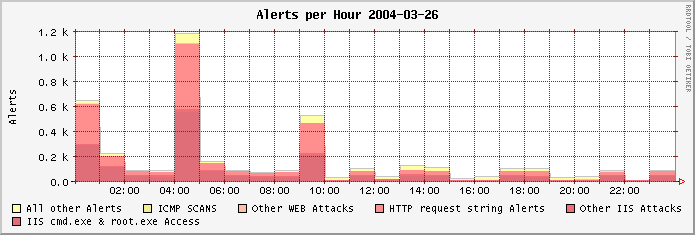
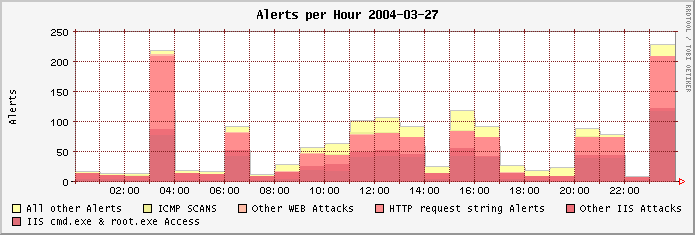
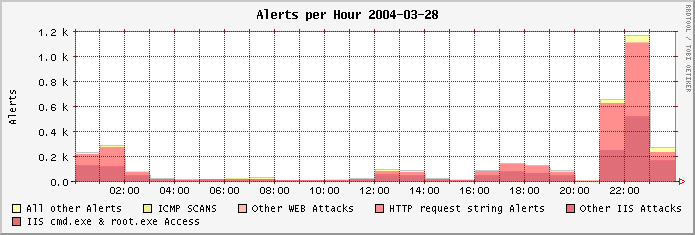
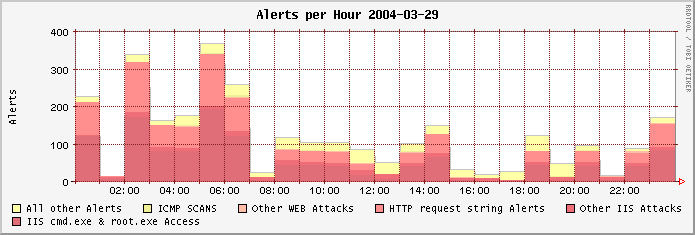
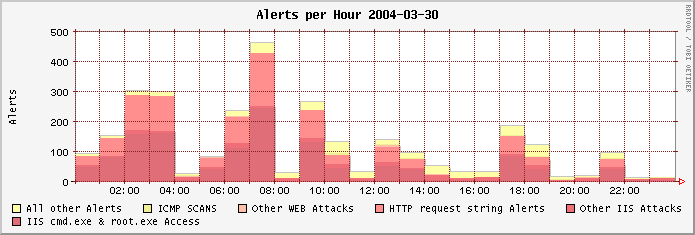
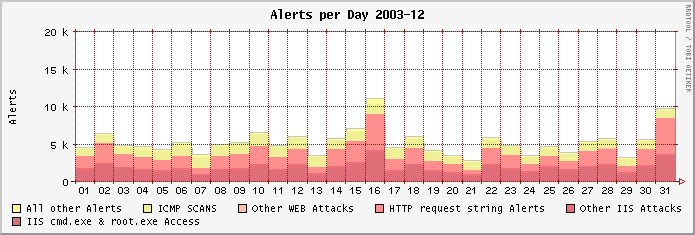
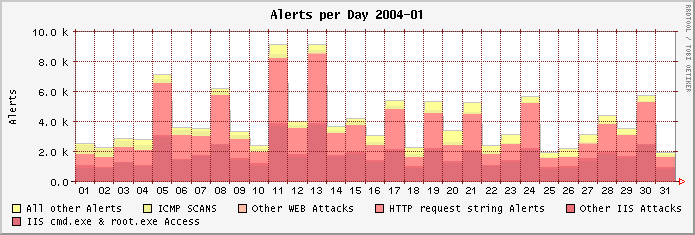
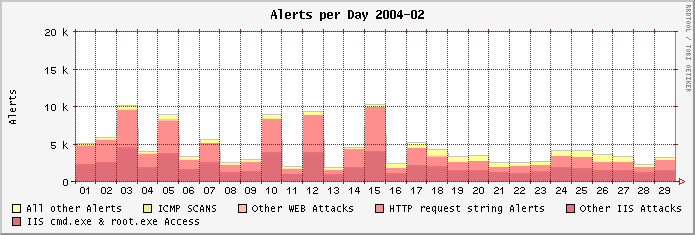
The following graphs show the number of the monitored attacks on each day, divided into the most significant classes.
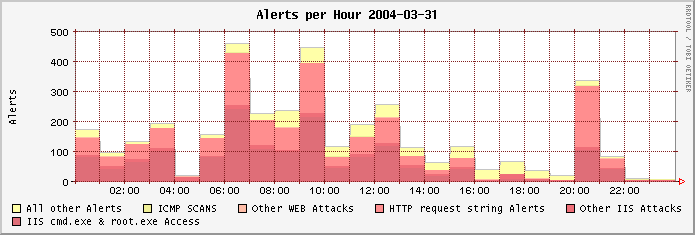
Links to the previous graphs:
| 2003-09: | 01 | 02 | 03 | 04 | 05 | 06 | 07 | 08 | 09 | 10 | 11 | 12 | 13 | 14 | 15 | 16 | ||||||||||||||||
| 17 | 18 | 19 | 20 | 21 | 22 | 23 | 24 | 25 | 26 | 27 | 28 | 29 | 30 | |||||||||||||||||||
| 2003-10: | 01 | 02 | 03 | 04 | 05 | 06 | 07 | 08 | 09 | 10 | 11 | 12 | 13 | 14 | 15 | 16 | ||||||||||||||||
| 17 | 18 | 19 | 20 | 21 | 22 | 23 | 24 | 25 | 26 | 27 | 28 | 29 | 30 | 31 | ||||||||||||||||||
| 2003-11: | 01 | 02 | 03 | 04 | 05 | 06 | 07 | 08 | 09 | 10 | 11 | 12 | 13 | 14 | 15 | 16 | ||||||||||||||||
| 17 | 18 | 19 | 20 | 21 | 22 | 23 | 24 | 25 | 26 | 27 | 28 | 29 | 30 | |||||||||||||||||||
| 2003-12: | 01 | 02 | 03 | 04 | 05 | 06 | 07 | 08 | 09 | 10 | 11 | 12 | 13 | 14 | 15 | 16 | ||||||||||||||||
| 17 | 18 | 19 | 20 | 21 | 22 | 23 | 24 | 25 | 26 | 27 | 28 | 29 | 30 | 31 | ||||||||||||||||||
| 2004-01: | 01 | 02 | 03 | 04 | 05 | 06 | 07 | 08 | 09 | 10 | 11 | 12 | 13 | 14 | 15 | 16 | ||||||||||||||||
| 17 | 18 | 19 | 20 | 21 | 22 | 23 | 24 | 25 | 26 | 27 | 28 | 29 | 30 | 31 | ||||||||||||||||||
| 2004-02: | 01 | 02 | 03 | 04 | 05 | 06 | 07 | 08 | 09 | 10 | 11 | 12 | 13 | 14 | 15 | 16 | ||||||||||||||||
| 17 | 18 | 19 | 20 | 21 | 22 | 23 | 24 | 25 | 26 | 27 | 28 | 29 | ||||||||||||||||||||
| 2004-03: | 01 | 02 | 03 | 04 | 05 | 06 | 07 | 08 | 09 | 10 | 11 | 12 | 13 | 14 | 15 | 16 | ||||||||||||||||
| 17 | 18 | 19 | 20 | 21 | 22 | 23 | 24 | 25 | 26 | 27 | 28 | 29 | 30 | 31 |
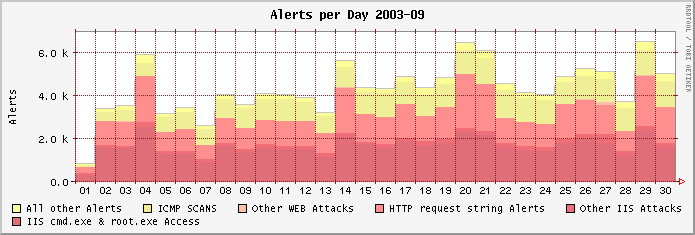
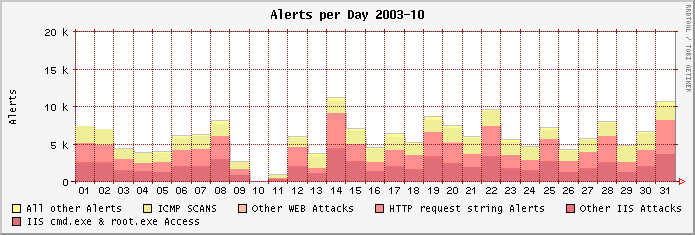
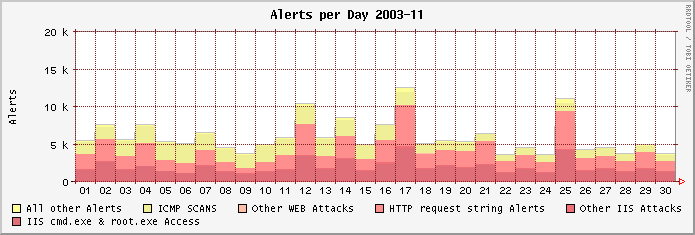
The following graphs show the number of the monitored attacks for full months, divided into the most significant classes.
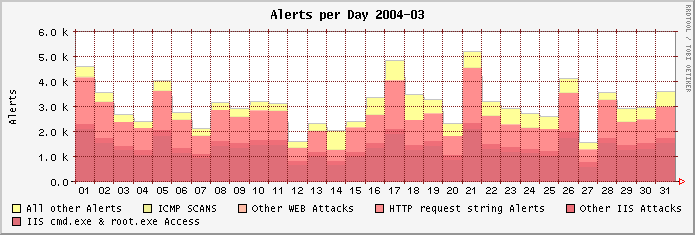
Links to the previous graphs:
| 2003-09 | 2003-10 | 2003-11 | 2003-12 | ||||
| 2004-01 | 2004-02 | 2004-03 |
It is interesting to see how many different attacks an attacker tries on a host. This gives us not only a feeling for the many threads that our systems are confronted with. It is also a good indication for the stubbornness of the attackers that sometimes try many different attacks to reach their goal. The following table lists the number of hosts (= source IP addresses) sorted by their number of different attacks.
| Attacks: | 1 | 2 | 3 | 4 | 5 | 6 | 7 | 8 | 9 | 10 | 11 | 12 | 13 | 14 | 15 | 16 | 17 | 18 | 20 | 25 | 90 | 132 | 143 | 159 | 235 | |||||||||||||||||||||||||
| 2003-09 | 13381 | 2393 | 1260 | 107 | 656 | 26 | 11 | 1 | 5 | 3 | 2 | 0 | 0 | 2 | 0 | 0 | 0 | 0 | 0 | 0 | 0 | 1 | 0 | 0 | 0 | |||||||||||||||||||||||||
| 2003-10 | 13547 | 3311 | 210 | 165 | 581 | 94 | 24 | 15 | 12 | 10 | 4 | 3 | 2 | 3 | 1 | 0 | 1 | 0 | 2 | 1 | 0 | 0 | 0 | 0 | 0 | |||||||||||||||||||||||||
| 2003-11 | 14027 | 3508 | 50 | 46 | 561 | 42 | 6 | 2 | 2 | 1 | 0 | 1 | 0 | 2 | 0 | 0 | 3 | 0 | 0 | 0 | 0 | 0 | 1 | 0 | 0 | |||||||||||||||||||||||||
| 2003-12 | 16472 | 6234 | 38 | 32 | 573 | 50 | 5 | 1 | 3 | 5 | 1 | 1 | 0 | 4 | 0 | 0 | 1 | 0 | 0 | 0 | 0 | 0 | 0 | 0 | 0 | |||||||||||||||||||||||||
| 2004-01 | 3595 | 1239 | 1363 | 60 | 502 | 51 | 8 | 0 | 1 | 1 | 1 | 5 | 1 | 1 | 0 | 0 | 1 | 1 | 0 | 0 | 1 | 0 | 0 | 0 | 0 | |||||||||||||||||||||||||
| 2004-02 | 3399 | 689 | 1381 | 56 | 465 | 41 | 11 | 2 | 4 | 6 | 0 | 3 | 0 | 0 | 0 | 1 | 0 | 0 | 0 | 0 | 0 | 0 | 0 | 1 | 1 | |||||||||||||||||||||||||
| 2004-03 | 5831 | 474 | 1080 | 59 | 464 | 42 | 14 | 5 | 3 | 2 | 1 | 0 | 0 | 0 | 0 | 0 | 0 | 0 | 0 | 0 | 0 | 0 | 0 | 0 | 0 |
As the data shows most of the attacks are only single tries (and many of them are ICMP scans as the previous sections indicate). But there are also some hard attackers firing all their guns on a single host.
Because the eCSIRT.net sensors are placed in separated networks all over Europe it is possible to measure how many of the attackers had more than one target among the sensors. If a host is seen by more than one sensor this indicates that he is actively searching for victims in the net. The following table lists the number of hosts (= source IP addresses) sorted by the number of sensors they attacked.
| Sensors: | 1 | 2 | 3 | 4 | 5 | 6 | ||||||
| 2003-09 | 17543 | 267 | 32 | 6 | 0 | 0 | ||||||
| 2003-10 | 17426 | 360 | 109 | 48 | 42 | 1 | ||||||
| 2003-11 | 17995 | 211 | 37 | 9 | 0 | 0 | ||||||
| 2003-12 | 23192 | 175 | 33 | 20 | 0 | 0 | ||||||
| 2004-01 | 6459 | 319 | 34 | 12 | 7 | 0 | ||||||
| 2004-02 | 5705 | 305 | 22 | 20 | 8 | 0 | ||||||
| 2004-03 | 7629 | 280 | 31 | 18 | 17 | 0 |
| eCSIRT.net > Service > Documents > WP4 Statistics | |
| (Partner) (Project) (News) (Background) (Service) |
|
The European Computer Security Incident Response Team Network News | Sitemap | Imprint | Privacy Statement | Contact | Top Last changed: 2004-04-01 / AUTO Copyright © 2002-2003 by PRESECURE Consulting GmbH, Germany |

|
